The Questions That Take a Day in a GIS
A city planner is asked whether a district really is a "15-minute city": can a resident walk to a hospital, a school, a park and a market in a quarter of an hour? A city government hears that a national-road bridge will close for six months and has to say how much longer the trip to the regional capital will take, and who loses the road to the nearest hospital. A property team wants to put "walkable" on a listing and be able to defend it. A disaster-resilience team asks which neighbourhoods are cut off from medical care when the one bridge or road they depend on goes under water.
These are all the same kind of question, about walking or driving time over a street network, and in practice they are answered by hand. Someone downloads the street network and the points of interest from OpenStreetMap (OSM), cleans the graph, snaps every hospital and park to the nearest street node, runs a shortest-path calculation from each of them, turns the result into areas, repeats it for every category and for the second neighbourhood, and then re-does the whole thing when somebody asks "and if the bridge is closed?". In a desktop GIS that is hours to days per question, and the answer lives in a project file that nobody else can rerun. The mistakes are quiet ones: a one-way street counted in both directions, a park reached from its centre across a fence, a circle drawn on the map where the network says otherwise.
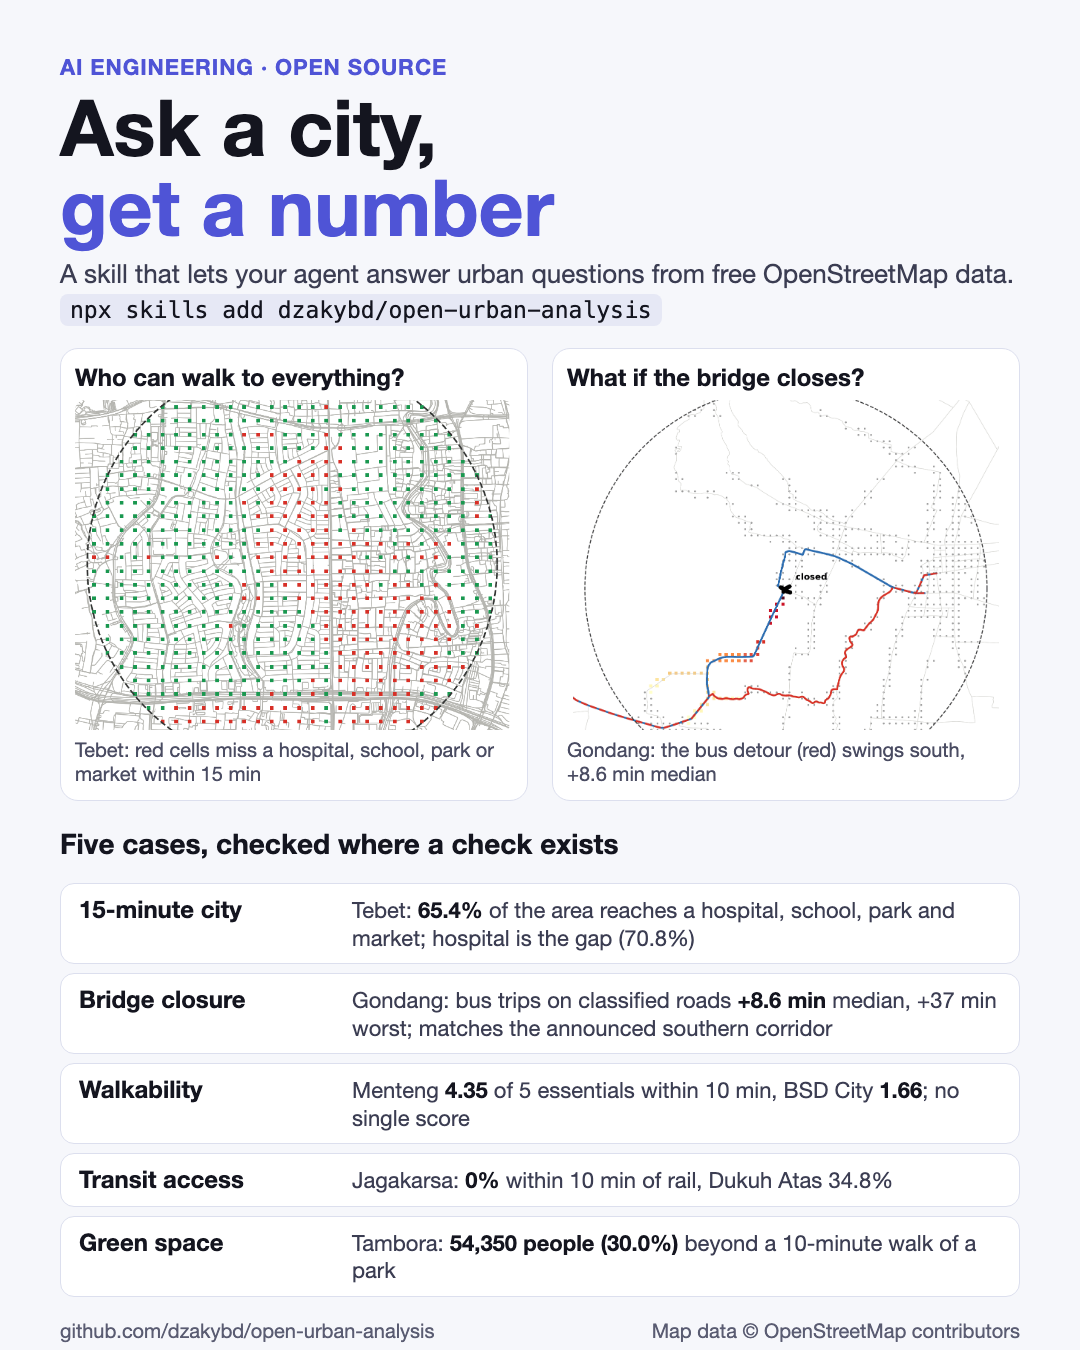
None of this needs computer vision or a trained model. OSM is already vector data, the street graph is a graph, and the right algorithm is a shortest path from the destinations. What is missing is the same thing that was missing in open-satellite-analysis and pid-parser: the glue between "here is a map" and "this share of the area, these people, and here is what the number cannot tell you". I built open-urban-analysis as a skill an agent can pick up: small scripts that do the measuring, and instructions that tell the agent how to use them. Give it an address or coordinates and a question, and it returns numbers, a map and a figure, plus the limits that apply. I tested it on five questions about places in Jakarta, Tangerang Selatan and Tulungagung.
Code: github.com/dzakybd/open-urban-analysis (MIT) · Demo: huggingface.co/spaces/dzakybd/open-urban-analysis
TL;DR
- What it is: a skill you attach to an agent so it can answer questions about a city from free OpenStreetMap data. Two versions, like the other skills: one for coding agents (
npx skills add dzakybd/open-urban-analysis) and a LangChain Deep Agents version.- How: six small scripts: pin the place, street-network statistics, walking or driving access to hospitals, schools, parks, markets and transit, POI coverage, side-by-side walkability, and road or bridge closure. Routing is NetworkX on the OSM street graph; OSMnx, GeoPandas and momepy do the rest. No account, no API key, no model training, so every number can be rerun.
- Reproducible data: the published runs read a dated Geofabrik extract of Java (27 October 2026) through
osmium, not the live Overpass API.- How well: only the bridge closure has an independent source (the announced diversion), and the model reproduces its direction but not its length. The other four cases are what OSM itself records, and each section says where a check is missing.
- Where it is weak: an unmapped facility looks like a missing one, OSM has no sidewalk quality, shade or safety, and there is no single walkability score, on purpose.
What It Is Useful For
Anything that starts with "how far is it, on foot or by road, from here to there, for everyone in this area?":
| Who asks | The question | Script |
|---|---|---|
| Urban planners | Is this district a 15-minute city? Which service is the gap? | accessibility.py |
| City and regency governments | What does the bridge closure do to trips, and who loses access to the hospital? | closure.py |
| Real estate and property | Is this neighbourhood walkable, and compared with what? | walkability.py |
| Transit agencies | Where is the transit desert? | accessibility.py |
| Public health and disaster resilience | Who lives beyond a walk of a park or a clinic, or loses the road to one? | accessibility.py --population, closure.py |
How It Works, Step by Step
The skill is a folder: a SKILL.md with the instructions, and standalone scripts that run with uv run and install their own dependencies. The agent reads the instructions, picks the scripts, runs them and reads the output. The agent only orchestrates; every route, distance and metric comes from the scripts, so a result can be reproduced.
| Step | Script | Output |
|---|---|---|
| 1. Pin the place | locate.py (Nominatim, or --lat/--lng) | aoi.json, a disc around the point |
| 2. Street network | network_stats.py | street length and density, intersection density, dead ends, circuity, meshedness, gamma |
| 3. Walking (or driving) access | accessibility.py | per-category share of the area within 5, 10 and 15 minutes, isochrones, optional GHSL population |
| 4. POI coverage | poi_coverage.py | counts and density per km², network versus straight-line reach |
| 5. Compare places | walkability.py | ten side-by-side metrics on equal discs, no score |
| 6. Closure simulation | closure.py | detours for random and named trips, --landmark check against the announced diversion, cells that lose access |
| 7. Share a result | every script | metrics.json, map.html (Folium), figure.png (matplotlib) |
npx skills add dzakybd/open-urban-analysis

uv run locate.py --lat -6.2345 --lng 106.8560 --radius-m 1500 --name "Tebet, Jakarta Selatan" --out work/aoi.json
uv run accessibility.py work/aoi.json --categories hospital,school,park,market --minutes 15 --population --out work/access
What it adds over a plain OSMnx query
OSMnx already downloads graphs and POIs. The skill covers the steps around it, where agents and people tend to go wrong:
- Network distance, not straight-line circles. A 1,200 m circle around the rail stations near Tebet claims 90.9% of the area; along the streets it is 48.2%, because rivers, the rail corridor and the toll road are barriers (
poi_coverage.py). - One-way streets counted the right way round. Access runs Dijkstra on the reversed graph, so the time is to the destination. Otherwise one-way segments fake symmetry.
- POIs are entered from their outline. A park or hospital campus is reached from points every 100 m along its boundary, not from a centroid across a fence. POIs up to 1,500 m outside the disc count too, so the edge of the area is not penalised.
- A grid, with the off-network cells left out. The area is a 100 m grid; a cell more than 200 m from any street (water, rail yards) is dropped and reported rather than silently counted as unreachable.
- Walking is 80 m a minute (4.8 km/h), a common planning speed for the 15-minute city. Driving uses assumed free-flow speeds by road class where
maxspeedis not tagged (trunk 45, primary 35, secondary 30, tertiary 25, residential 20 km/h), stated as assumptions for ranking routes, not measured traffic. - Weighted by who lives there, optionally.
--populationadds the 100 m GHSL GHS-POP grid to every coverage number, so "35.2% of residents" is not the same as "34.6% of cells". - Reproducible downloads. Set
OUA_PBFto a dated Geofabrik extract and the graph and POIs are clipped out of it withosmium. The live Overpass API is a shared volunteer service that is often at capacity and changes daily; the scripts back off and rotate mirrors, but the published runs avoid it altogether. - No walkability score. A single number hides which assumption decided the ranking.
Experimental Setup
Everything below is from cases.sh, which reruns all five cases from scratch:
| Data | OSM, java-latest.osm.pbf of 27 October 2026 (Geofabrik), clipped with osmium; Nominatim only to find places |
| Areas | discs of equal radius per question: 1.5 km (7.07 km²) for Tebet, Menteng, BSD City and Tambora, 2 km (12.57 km²) for the transit pair, 8 km for the Gondang drive network |
| Walking | 4.8 km/h on footways, paths and streets; limit 15 minutes (10 for transit, parks and walkability) |
| Driving | free-flow, speeds by road class; no traffic |
| Population | GHSL GHS-POP R2023A, 100 m, 2020 epoch (a model, not a census) |
| Check | a published source where one exists; otherwise a second OSM backend or a sensitivity run |
Results at a Glance
| Question | Place | Result | Checked against |
|---|---|---|---|
| Who is within a 15-minute walk of a hospital, school, park and market? | Tebet, South Jakarta | 65.4% of the area reaches all four; 44,245 residents (35.2%) miss at least one; hospital is the gap (70.8%) | the other OSM backend (±4 pp); no official facility list |
| What if the bridge closes? | Jembatan Gondang I, Tulungagung–Trenggalek | car: 20.5% of trips slower, median +3.6 min; bus on classified roads: median +8.6 min, worst +37.2 min | announced diversion (news): direction matches, length does not |
| Which neighbourhood is more walkable? | Menteng vs BSD City | 4.35 vs 1.66 of 5 essentials within 10 min; 400 vs 319 intersections per km² | none (what OSM records) |
| Is this a transit desert? | Jagakarsa vs Dukuh Atas | rail within 10 min: 0% vs 34.8%; TransJakarta-tagged stops: 93% vs 95.1% | TransJakarta route map, partially |
| Who lives beyond a 10-minute walk of a park? | Tambora, West Jakarta | 70.9% of the area within 10 min; 54,350 people (30.0%) beyond | none (what OSM records) |
Five Cases
1. The 15-minute city: Tebet, South Jakarta
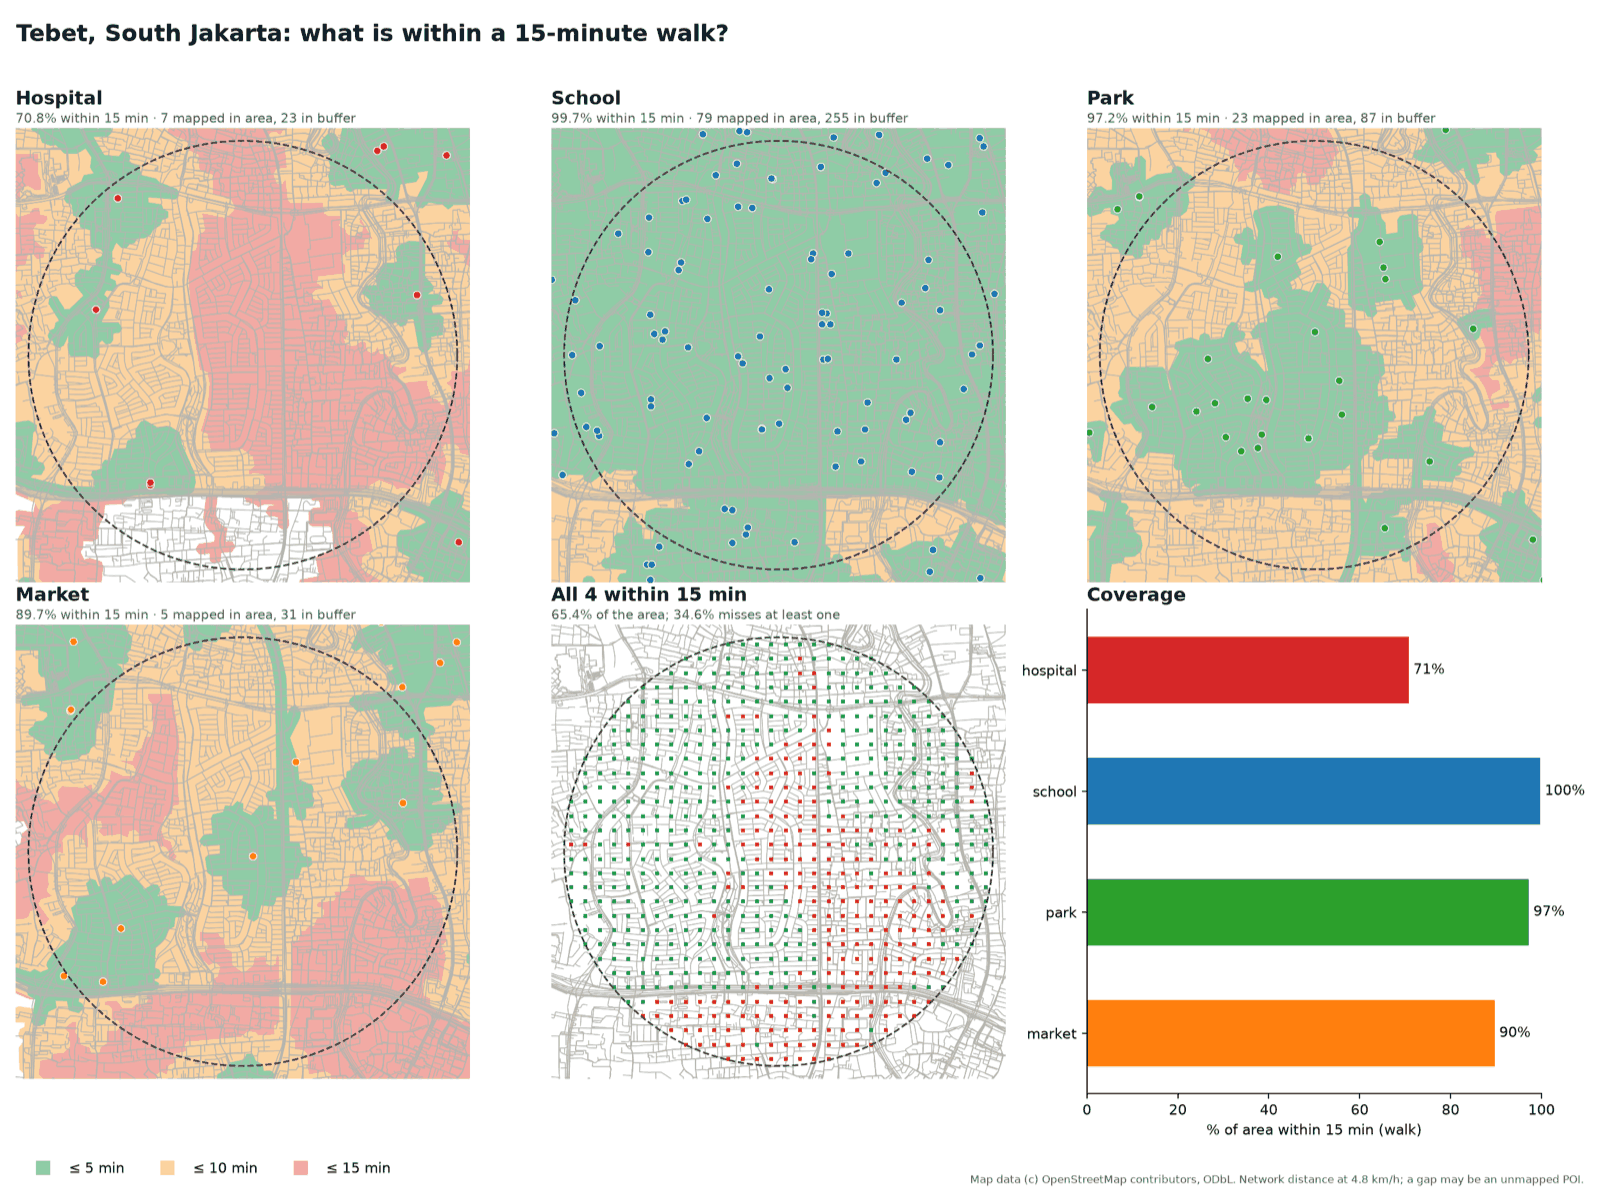
The recipe, after the 15-minute city idea of Moreno et al. (2021): a 1.5 km disc around -6.2345, 106.8560 (7.07 km², 125,859 residents by GHSL), walking at 4.8 km/h with a 15-minute limit, to hospitals, schools, parks and markets.
| Category | POIs mapped in area | Within 15 min | Median walk | People beyond |
|---|---|---|---|---|
| Hospital | 7 | 70.8% | 11.5 min | 37,258 |
| School | 79 | 99.7% | 3.1 min | 334 |
| Park | 23 | 97.2% | 7.3 min | 4,543 |
| Market | 5 | 89.7% | 9.2 min | 13,203 |
65.4% of the area reaches all four within 15 minutes, and 0.1% reaches none. The street network behind it, from network_stats.py, is 409.8 km of streets (58.0 km/km²), 532.6 intersections per km², 11.9% dead ends and a circuity of 1.093: a dense, fine grid, where the barriers are the rail line, the river and the toll road rather than the street pattern. In the first figure above, the red cells that miss at least one category form a band through the middle of the disc, and the hospital panel shows why: the mapped hospitals sit toward the edges, and the middle of the disc is 10 to 15 minutes from the nearest one.
Failure analysis: one dental clinic. Counted naively, 80.4% of the area reaches a hospital. One of the eight points the raw tags call a hospital inside the disc is "Ocean Dental Tebet", a dental clinic tagged amenity=hospital in OSM. With it counted, the hospital share is 80.4% and the share of the area reaching all four categories rises from 65.4% to 75.0%; the share of residents missing at least one falls from 35.2% (44,245 people) to 26.8% (33,668). One mis-tagged point moved the headline by nearly nine points. The script now has --exclude-name to drop a POI by name, the published run uses it, and the run without it is kept (access-raw) as the sensitivity check. The tool cannot find such a point by itself, which is why every answer lists the POIs it counted.
Failure analysis: two OSM backends. The same run against the live Overpass API instead of the dated extract gives identical POI counts and 61.6% instead of 65.4% for all four categories (hospital 68.9% vs 70.8%, market 93.2% vs 89.7%). The two graph builders disagree on a few short links (foot-access and service-street filtering), and Overpass was two days of edits ahead of the snapshot. Read any single percentage with a ±4 percentage-point band; the order of the categories (hospital the gap, schools and parks fine) is the same on both.
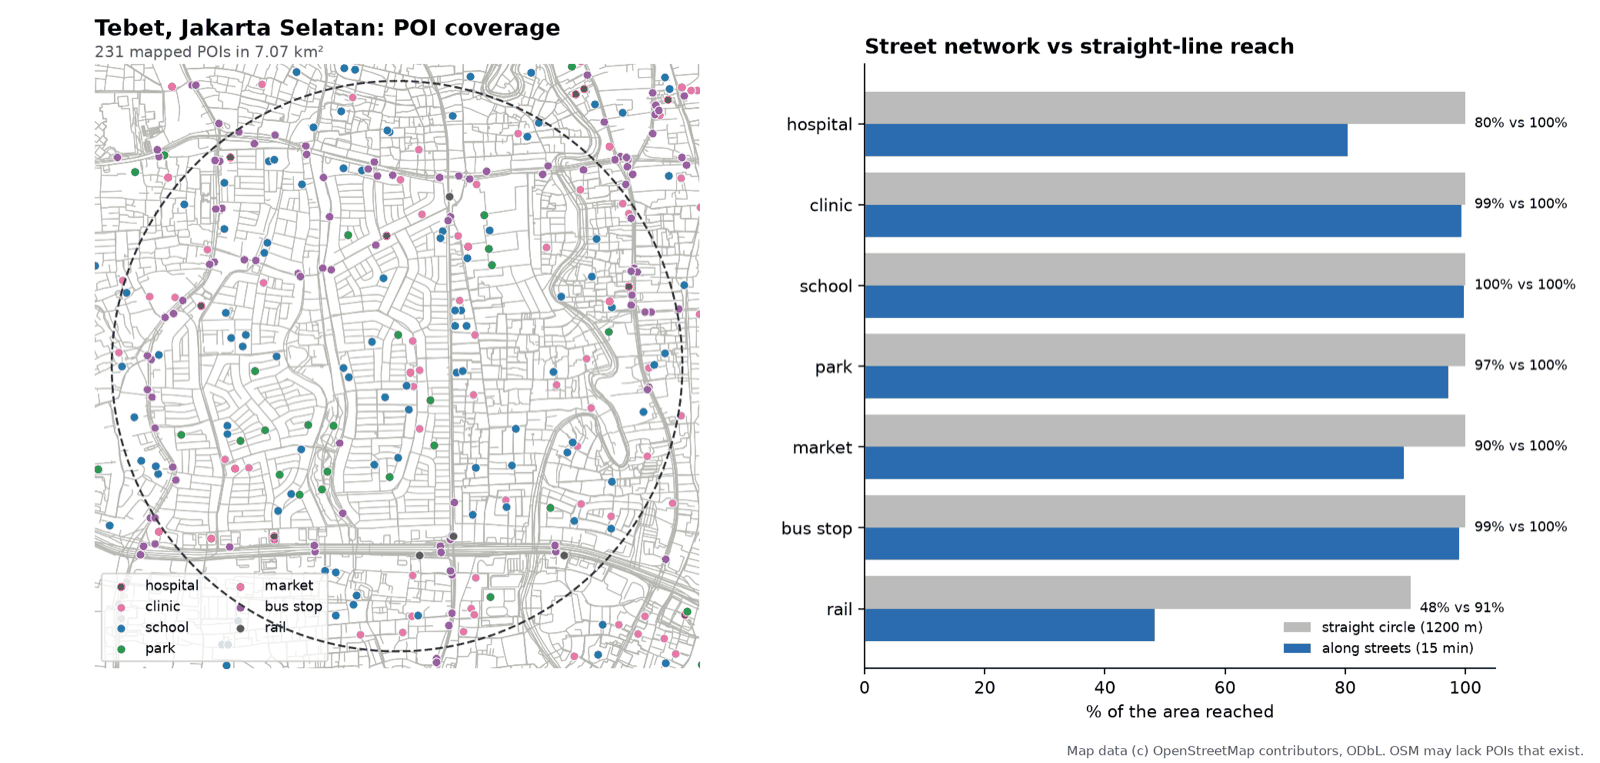
A circle overstates reach. For rail, a plain 1,200 m circle around the stations claims 90.9% of the area; along the streets it is 48.2%, with 4 stations mapped inside the disc and a median walk of 15.5 minutes. The gap is what the rail corridor, the river and the toll road remove.
2. A bridge closes: Jembatan Gondang I, Tulungagung
Jembatan Gondang I carries the national road between Tulungagung and Trenggalek in East Java. It closed for rebuilding on 2 June 2026 and was announced to stay shut until 11 December. I simulated the closure on the 8 km drive network around it: remove every road edge within 150 m of the bridge (--close-near=-8.0717,111.84665,150), then measure what happens to 62,250 random trips inside the area, to two named routes (Terminal Gayatri Tulungagung to Durenan, Trenggalek; Tulungagung to Trenggalek), and to the time to the nearest of the 7 mapped hospitals.
| Scenario | Trips slower by over 1 min | Median extra | p90 | Max | Cut off |
|---|---|---|---|---|---|
| Car, every OSM road | 20.5% | +3.6 min | +4.0 min | +8.2 min | 0% |
Bus, trunk, primary, secondary and tertiary only (--classes) | 14.7% | +8.6 min | +16.0 min | +37.2 min | 1.6% |
The two named routes gain 3.6 to 3.7 minutes by car and 8.1 minutes by bus. For the hospital, the median time barely moves (13.2 to 13.6 minutes by car), but 22.0% of the grid cells get more than one minute slower, and 0.8% lose access to a hospital within 30 minutes by car (1.1% by bus, with up to 20.8 extra minutes).
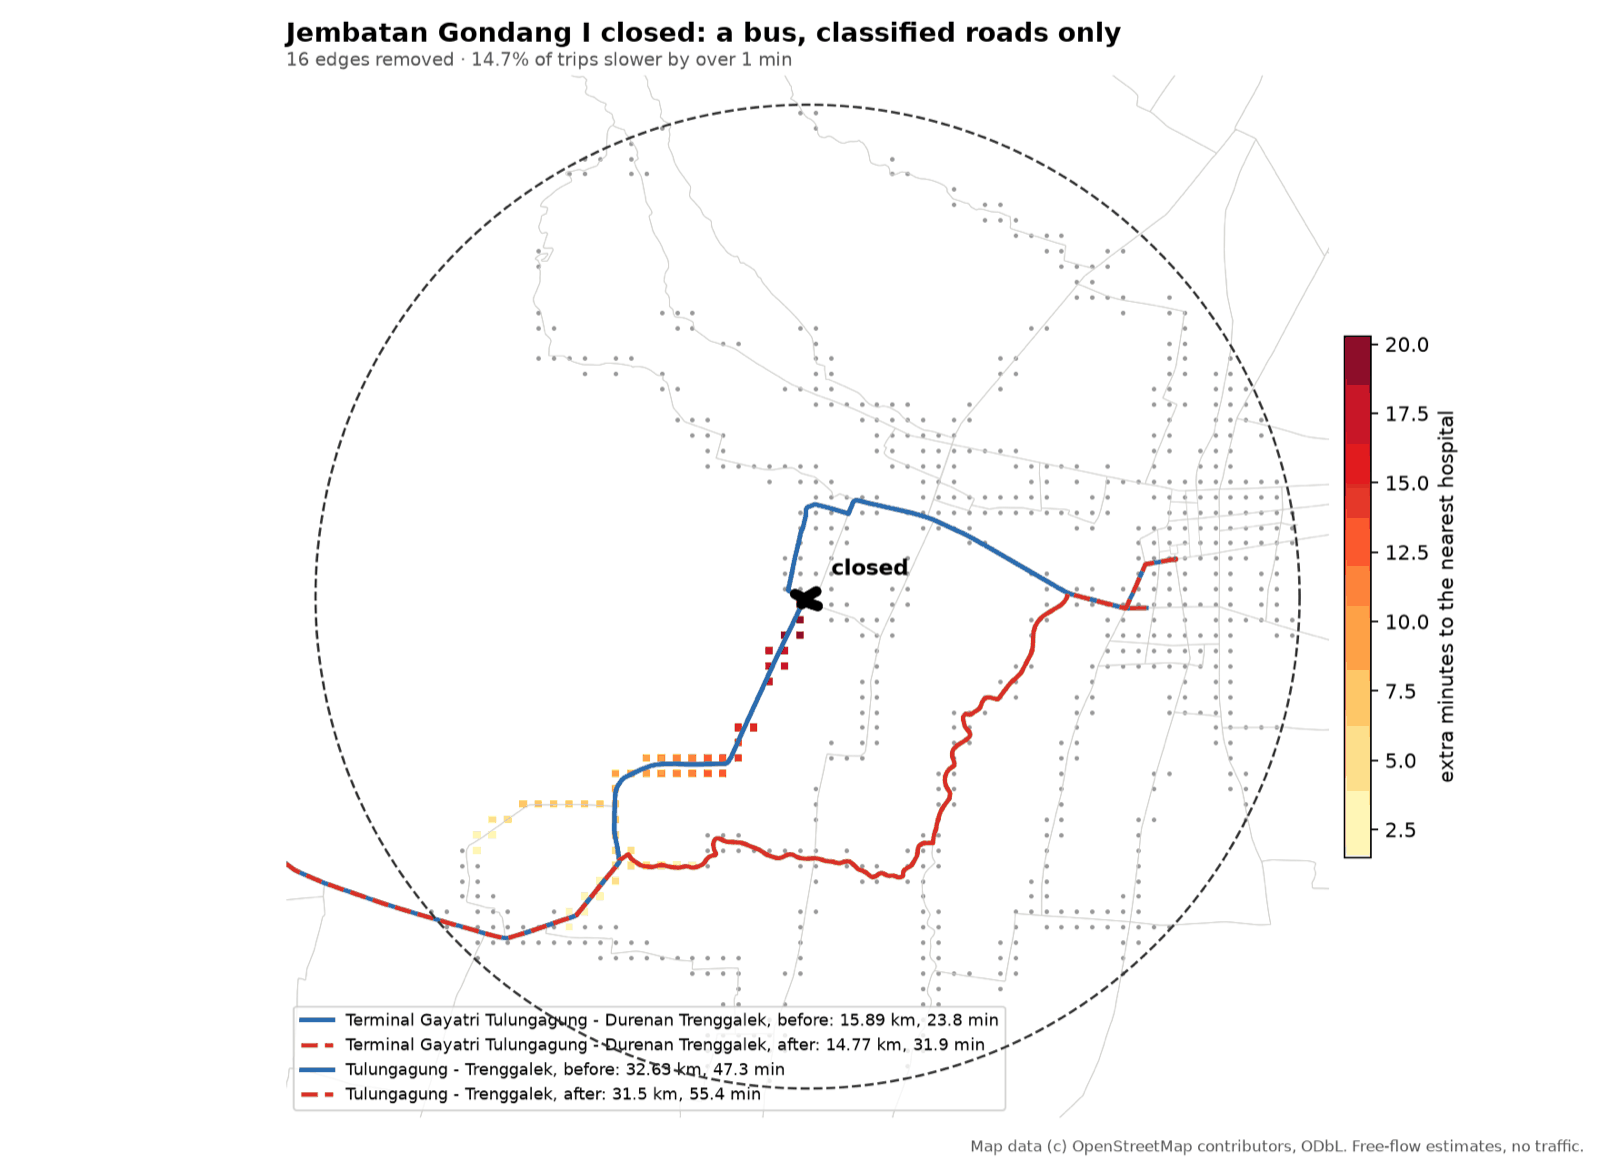
Against the announced diversion. The police sent light vehicles through small lanes around Mojoarum and Kalangbret, and heavy vehicles (buses, six-wheel trucks) south via Simpang Tamanan–Campurdarat–Pakel–Bandung, about 10 km longer (detik, 2 Jun 2026; Antara, 2 Jun 2026; Kompas, 2 Jun 2026; Kompas on the bus rerouting, 9 Jun 2026). The model was never told which roads are which, and it still reproduces the split: the car detour stays on the small lanes near Mojoarum and Kalangbret (its closest approach is 538 m and 627 m), and on classified roads only the bus detour swings south through the Campurdarat corridor (the landmark check: the bus route's closest approach to Mojoarum goes from 11 m to 3.6 km and to Bendungan from 124 m to 3.4 km, while Campurdarat goes from 6.8 km to 5.8 km).
What the check cannot say: the length. The model's bus detour is 1.1 km shorter than the direct run (14.8 against 15.9 km, 8.1 minutes slower on lesser roads), while the announced heavy route adds about 10 km. Both named routes end inside the 8 km analysis disc, so a trip leaves the disc long before it traces the full announced loop: the comparison validates the corridor, not the distance. Part of the gap may also be real: the police chose the long loop for road width and weight, which OSM's free-flow model does not see. The bridge reopened to traffic on 24 October 2026 while finishing works continue (Antara Jatim), so the simulation describes the closure period.
Failure analysis: closing the bridge was the hard part. OSM draws this bridge as a small man_made=bridge polygon, with the road under it untagged and several small alley bridges beside it. Three attempts shaped the tool:
--bridge-onlywithin 80 m removed four minor streets and changed no route, because nothing matched the real span.- Closing only the trunk road within 30 m was bypassed through the alley bridges within metres.
- Closing every road within 150 m cut the crossing (34 edges, 3.2 km of road for the car case, 16 edges, 1.4 km for the bus case).
That is why the script closes a radius, prints the removed edges (closed.geojson) and checks --landmark distances: a closure that does not change a named route is a wrong closure, not a small effect.
3. Walkability compared: Menteng vs BSD City
Menteng (laid out in the 1920s) and BSD City (a planned new town of the 2000s in Tangerang Selatan), equal 1.5 km discs, ten metrics side by side.
| Metric | Menteng | BSD City |
|---|---|---|
| Street density | 49.3 km/km² | 41.6 km/km² |
| Intersection density | 400.1 /km² | 318.9 /km² |
| Dead-end share | 10.8% | 11.1% |
| Circuity | 1.083 | 1.136 |
| Meshedness | 0.193 | 0.126 |
| Pedestrian-only ways | 9.5 km/km² | 7.7 km/km² |
| Mapped crossings | 26.4 /km² | 7.6 /km² |
| Mapped sidewalks | 4.9% of length | 2.7% |
| Essentials within 10 min | 4.35 of 5 | 1.66 of 5 |
| All 5 within 10 min | 49.6% of the area | 2.8% of the area |
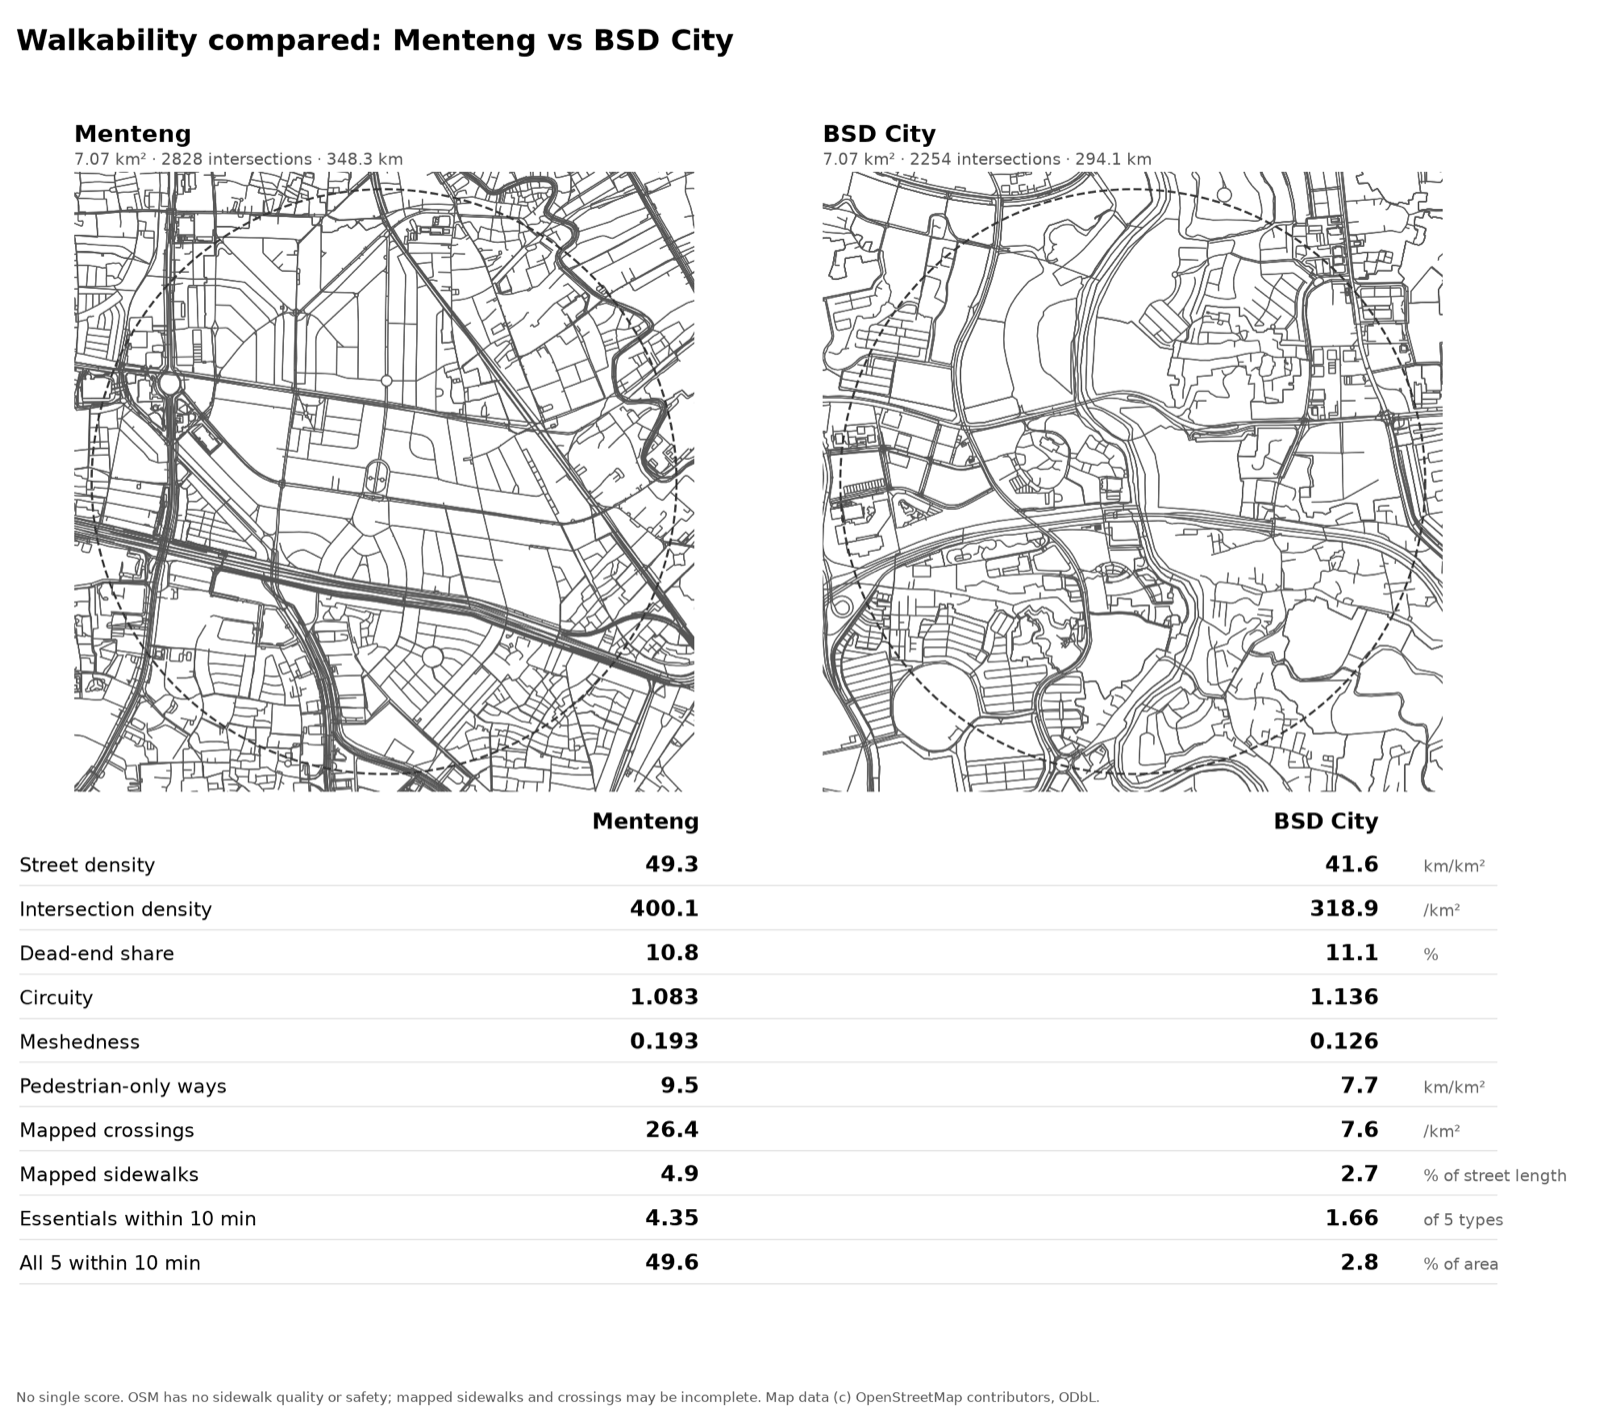
The maps tell the story the numbers summarise: Menteng is a fine-grained grid with schools and markets inside the blocks; BSD is clusters of cul-de-sacs feeding arterial loops, with big plots still undeveloped inside the disc. The essentials are a school, a market, a park, a clinic and a transit stop.
Failure analysis: which of these numbers measure the place, and which measure the mappers. The street metrics (intersection density, circuity, meshedness) come from the street graph and do not depend on how many POIs were mapped; they agree on the direction. The rest is less safe:
- Mapped sidewalks and crossings measure mapper effort as much as pavement. Jakarta is far better mapped than a 2000s new town, so a 26.4 against 7.6 crossings per km² partly reads the mappers.
- The essentials count depends on how many POIs were mapped. BSD City has 1 market and 1 clinic mapped in the disc against 11 and 30 in Menteng, and 14 schools against 45. A market or a clinic that exists but is untagged lowers BSD's score. I did not check on the ground how many are missing, so the 1.66 is a lower-bound reading of BSD; the gap in parks (89.4% against 64.7% within 10 minutes) and transit (97.3% against 48.3%) is on categories that are better mapped, and agrees with the street pattern.
- OSM records nothing about shade, sidewalk width, traffic speed or safety.
This is why the script prints ten transparent metrics instead of one score: a score would have blended the metrics that measure the place with the ones that measure the mappers, and hidden which one decided the ranking.
4. Transit access: Jagakarsa vs Dukuh Atas
Equal 2 km discs, a 10-minute walk, to OSM rail stations, stops tagged TransJakarta and all bus stops. Jagakarsa in South Jakarta is the suspected desert; Dukuh Atas, where four rail lines and the BRT corridors meet, is the benchmark.
| Jagakarsa | Dukuh Atas (benchmark) | |
|---|---|---|
| Rail within 10 min | 0% (0 stops mapped) | 34.8% (10 stops, median 12.4 min) |
| TransJakarta-tagged stops | 93.0% (121) | 95.1% (185) |
| Any bus stop | 93.0% (126) | 95.6% (197) |
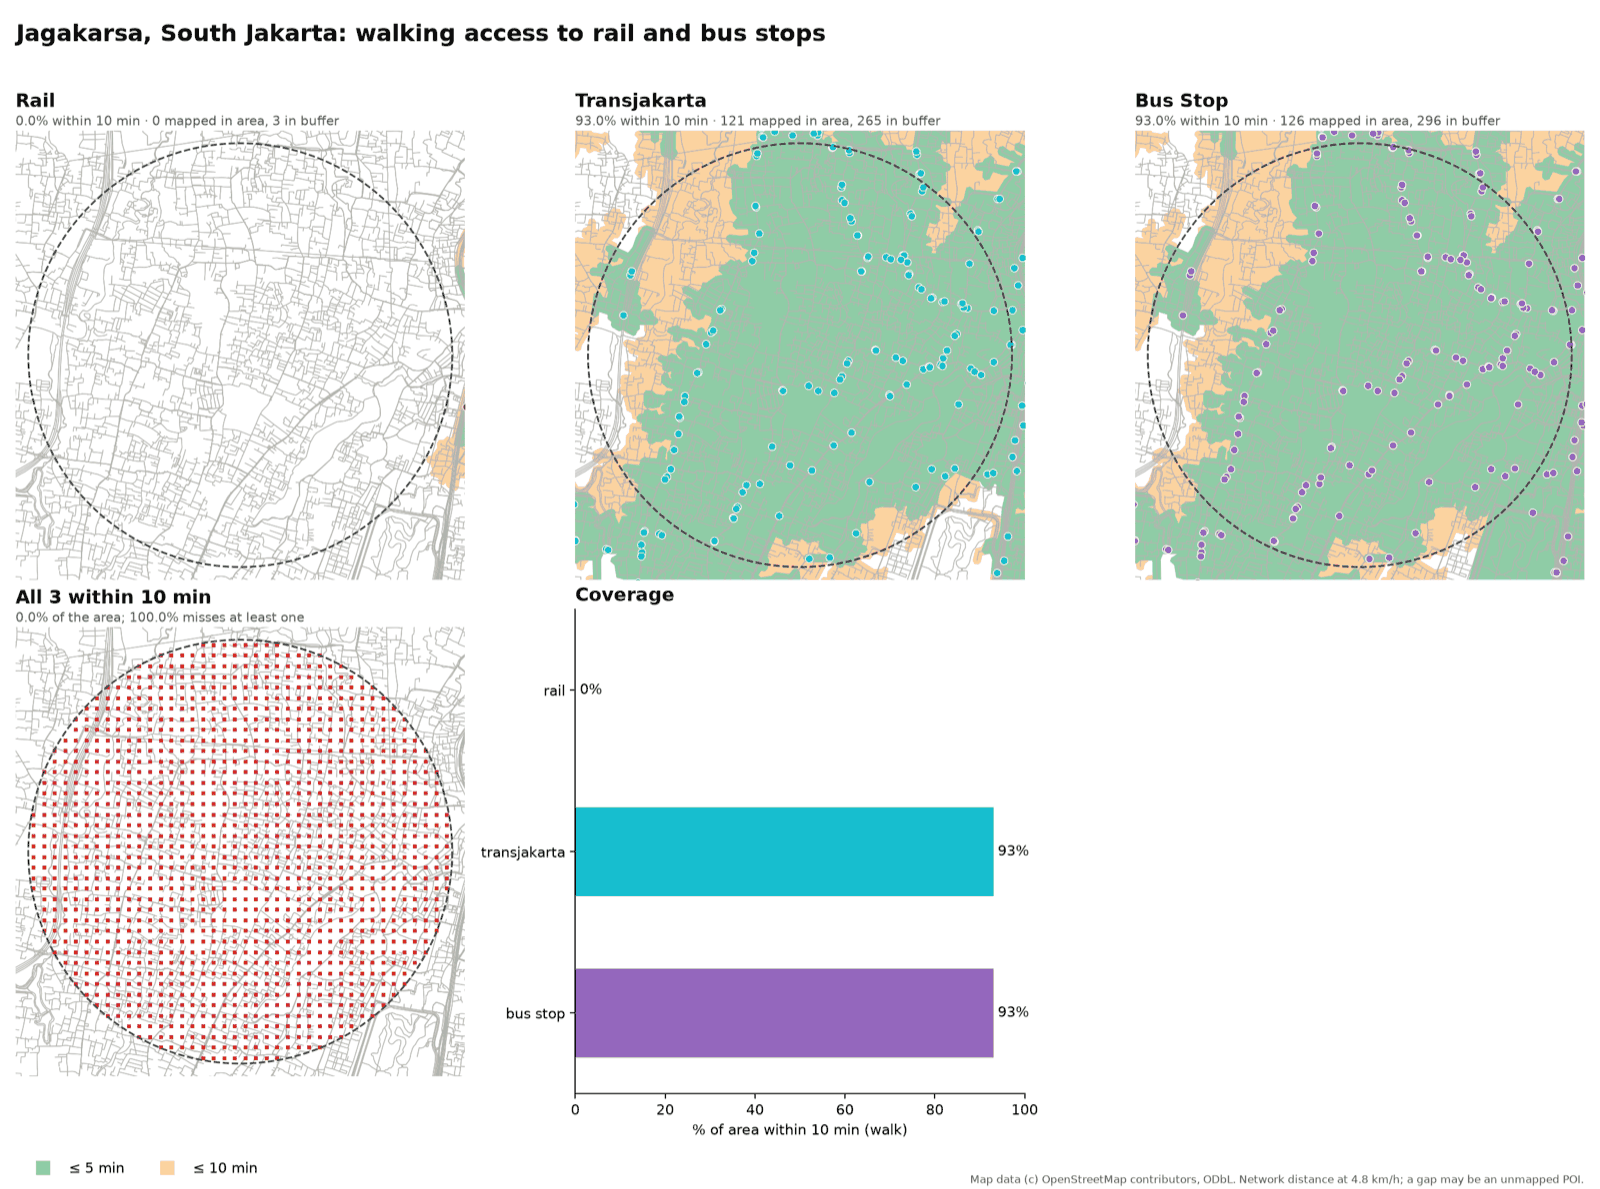
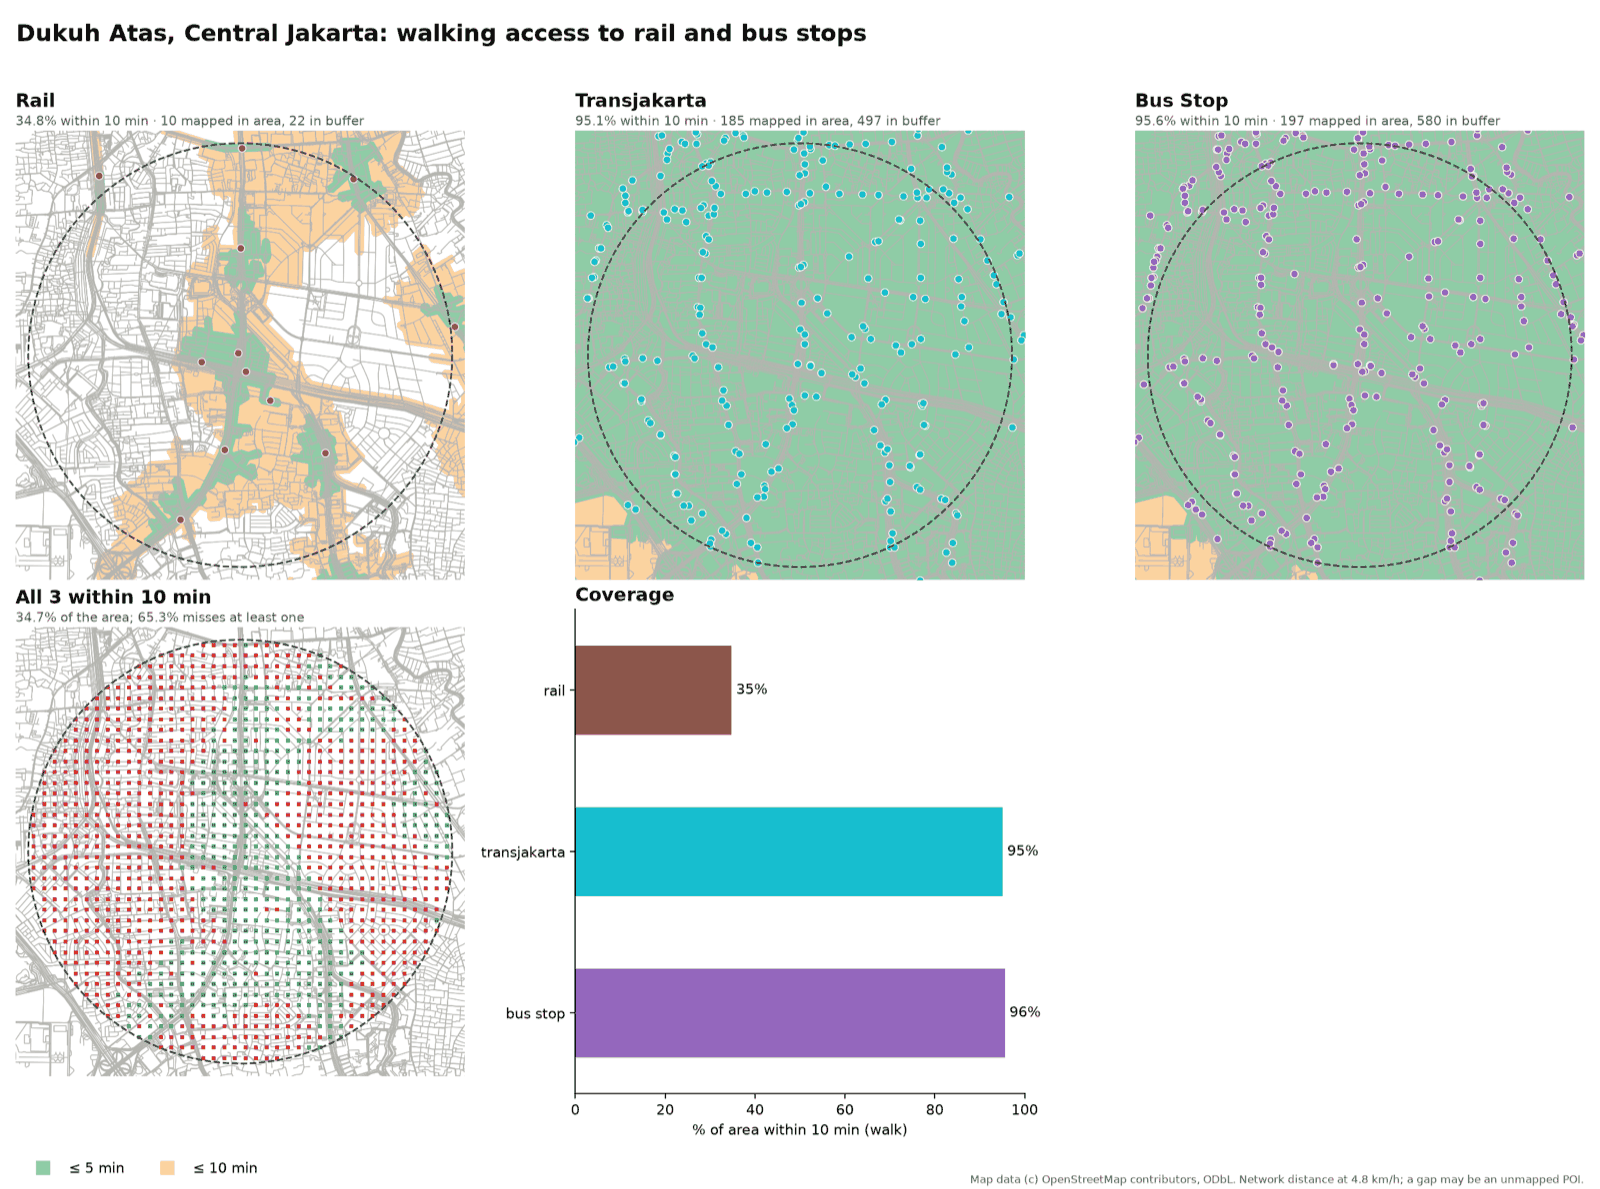
The pairing makes the traps visible. Jagakarsa has no rail within reach (the three stations OSM has just outside the disc are a median 51 minutes away on foot) and 93% "TransJakarta" coverage, which looks like the opposite of a desert. The reason is in the tags: Mikrotrans feeder vans are tagged network=TransJakarta, so the category measures the minibus feeder web, not the BRT corridors. The desert is real but specific: no rapid transit within a 10-minute walk, with dense feeder stops. The benchmark shows how high the bar is: even around Dukuh Atas only 34.8% of the disc is within a 10-minute walk of a rail stop, because a 2 km disc is big and stations are few. The corridors were cross-checked against TransJakarta's published route map; the feeder-stop counts are OSM-only and not independently checked.
5. Green space with population: Tambora, West Jakarta
A 1.5 km disc, a 10-minute walk to a park (the OSM tags park, garden and playground), weighted by the GHSL population grid.
Tambora packs about 181,000 people into the 7.07 km² disc, around 25,600 per km², among the densest ground in Jakarta, and its 17 mapped parks are small pocket greens clustered toward the disc's edge. 70.9% of the area is within a 10-minute walk of one, with a median walk of 7.7 minutes and a 90th percentile of 12.8. The 29.1% beyond is the white core on the figure, and it is where most of the people are: 54,350 residents (30.0%) live farther than a 10-minute walk from any mapped park.
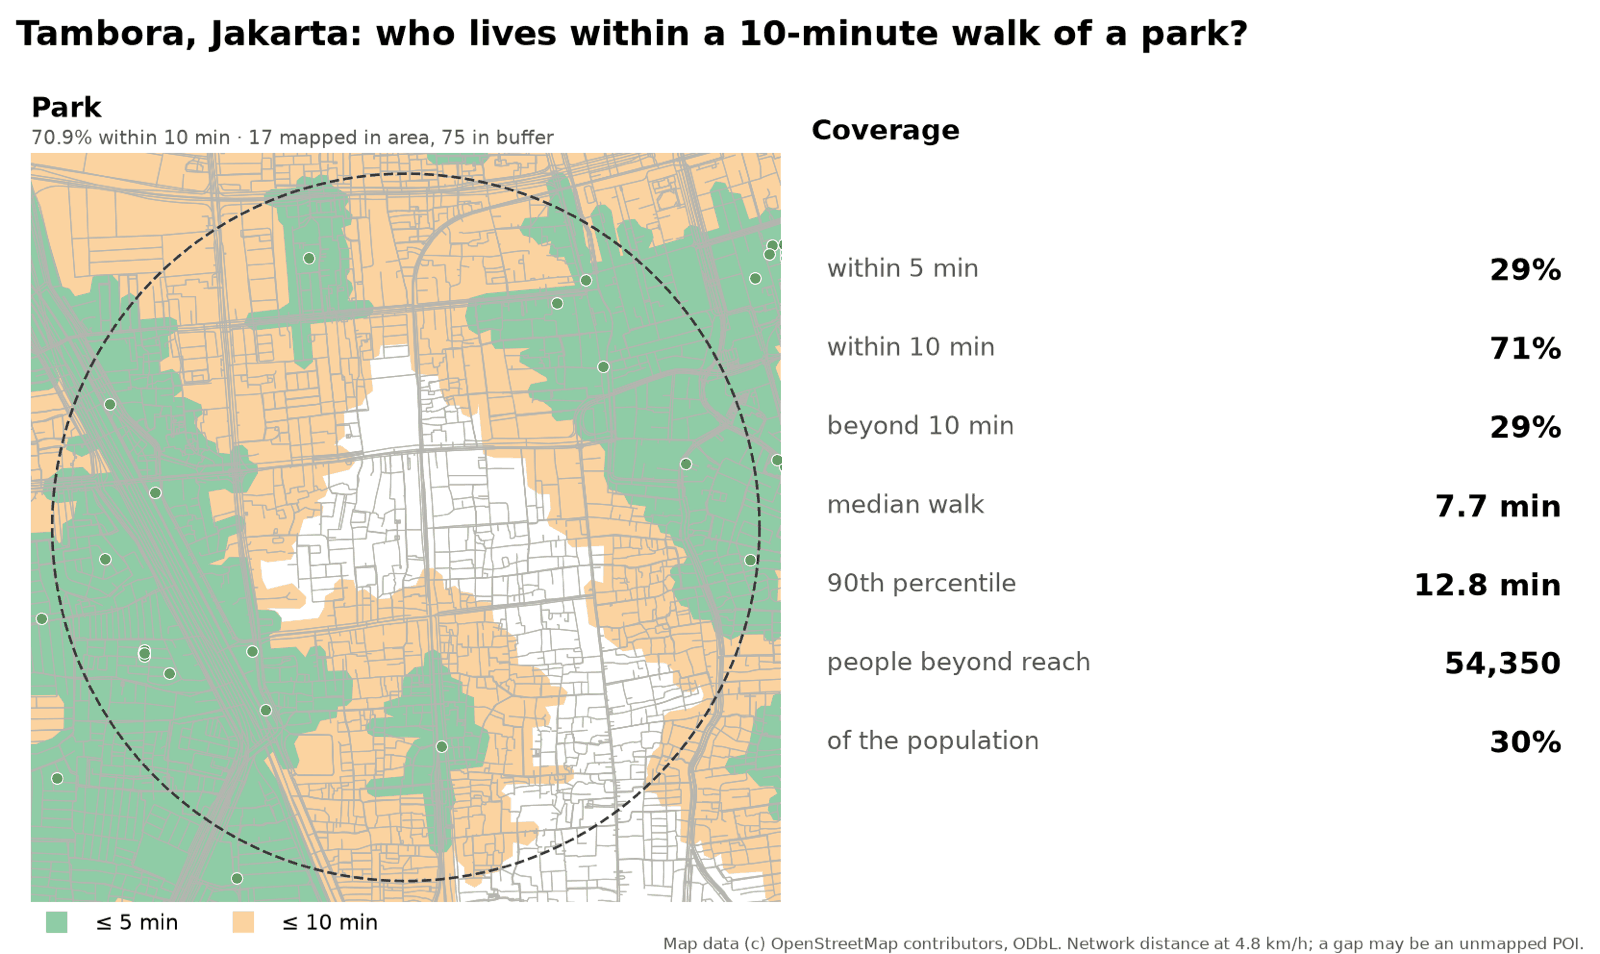
What the check cannot say. No independent ground truth for park access exists here, so the number is what OSM records. Small neighbourhood fields and RT-level open spaces are exactly what mappers most often leave out, so the 30.0% is more likely an overstatement of the gap than an understatement of it. A park enters the calculation from points along its outline, so a fenced or gated green counts where its gate is, which the tags cannot tell.
Asking a Deep Agent
The scripts are the same whether a person runs them or an agent does. The LangChain Deep Agents version loads the same SKILL.md, so a fix to the skill reaches both. It runs on a ChatGPT subscription through the sign in with ChatGPT provider, so no API key is needed.
git clone https://github.com/dzakybd/open-urban-analysis
cd open-urban-analysis && uv sync

# once: sign in with your ChatGPT account
uv run python -c "from langchain_openai.chatgpt_oauth import login_chatgpt; login_chatgpt()"

uv run python agent/run.py runs/my-question \
  "What share of Tebet, South Jakarta is within a 15-minute walk of a hospital, school, park and market? Use -6.2345, 106.8560 with a 1.5 km radius."
The agent writes answer.md and run.json (time, tool calls, tokens). I ran the five cases above through the scripts directly with cases.sh; I have not benchmarked how well an agent chooses between the scripts on these questions, so I make no claim about that here.
Limits of OSM Data
- A gap is not a missing facility. The scripts measure access to POIs that OSM has. A school, clinic or market nobody mapped looks like a gap; one mapped in the wrong place, or tagged wrongly like the dental clinic, looks like access. Markets and small clinics are the least complete categories, so every answer says how many POIs were found and names them.
- No single walkability score, and no sidewalk quality, shade, lighting, traffic speed or safety. The mapped sidewalk share mostly measures mapper effort.
- Walking time is network distance at 4.8 km/h. No stairs, slope, waiting at crossings or flooding. Mapped barriers (rivers, rail, toll roads) are respected; unmapped ones are not.
- Driving times are free-flow. A closure detour on a busy day is longer than the minutes reported, and a back road missing from OSM makes a detour look longer than it is.
- Areas are discs on a 100 m grid. It is area, not people, unless
--populationis used, and GHSL is a model, not a census. - The two backends differ by a few points. 65.4% against 61.6% on the Tebet all-category metric, from graph filters and from edits between the snapshot and the live API.
- The tag is not the thing.
network=TransJakartamatches Mikrotrans vans, andamenity=hospitalmatches a dental clinic.
Try It
- Install the skill:
npx skills add dzakybd/open-urban-analysis, then ask your agent something like "what share of this district is within a 15-minute walk of a hospital, school, park and market?" or "what happens if this bridge closes?" - Browse the five cases in the demo Space: figures, interactive maps and numbers, in your browser.
- Read the scripts and the Deep Agents runner: dzakybd/open-urban-analysis. Everything it touches is free.
If you work with a district's services, a road network or a property market: which place would you ask about first, and what in OSM would break it? I would like to know where it would and would not fit.
Built On
None of this is built from scratch. The skill is glue around other people's open work:
| Part | What it does here |
|---|---|
| OSMnx (Boeing, 2017) | Downloads and builds the street graph and POIs from OpenStreetMap |
| NetworkX, GeoPandas, momepy | Shortest paths, geometry, and the meshedness and gamma indices |
| folium, matplotlib | The interactive maps and the figures |
| osmium-tool and Geofabrik extracts | The dated, offline OSM backend |
| OpenStreetMap and Nominatim | The map data (© OpenStreetMap contributors, ODbL) and the geocoder |
| GHSL GHS-POP R2023A (European Commission, JRC) | The 100 m population grid |
| LangChain Deep Agents and the skills CLI | The agent runner and the npx skills add install |
The pattern comes from my earlier open-satellite-analysis and pid-parser: scripts that measure, and a SKILL.md that tells the agent how to use them.
References
- Boeing, G. (2017). OSMnx: New methods for acquiring, constructing, analyzing, and visualizing complex street networks. Computers, Environment and Urban Systems, 65, 126–139.
- Moreno, C. et al. (2021). Introducing the "15-Minute City": Sustainability, resilience and place identity in future post-pandemic cities. Smart Cities, 4(1), 93–111.
- Schiavina, M. et al. (2023). GHS-POP R2023A, GHS population grid multitemporal (1975–2030). European Commission, Joint Research Centre.
- OpenStreetMap contributors. Planet data via Geofabrik,
java-latest.osm.pbf, 27 October 2026 (ODbL). - News used as ground truth for the Gondang case is linked in that section: detik, Antara, Kompas, Antara Jatim.