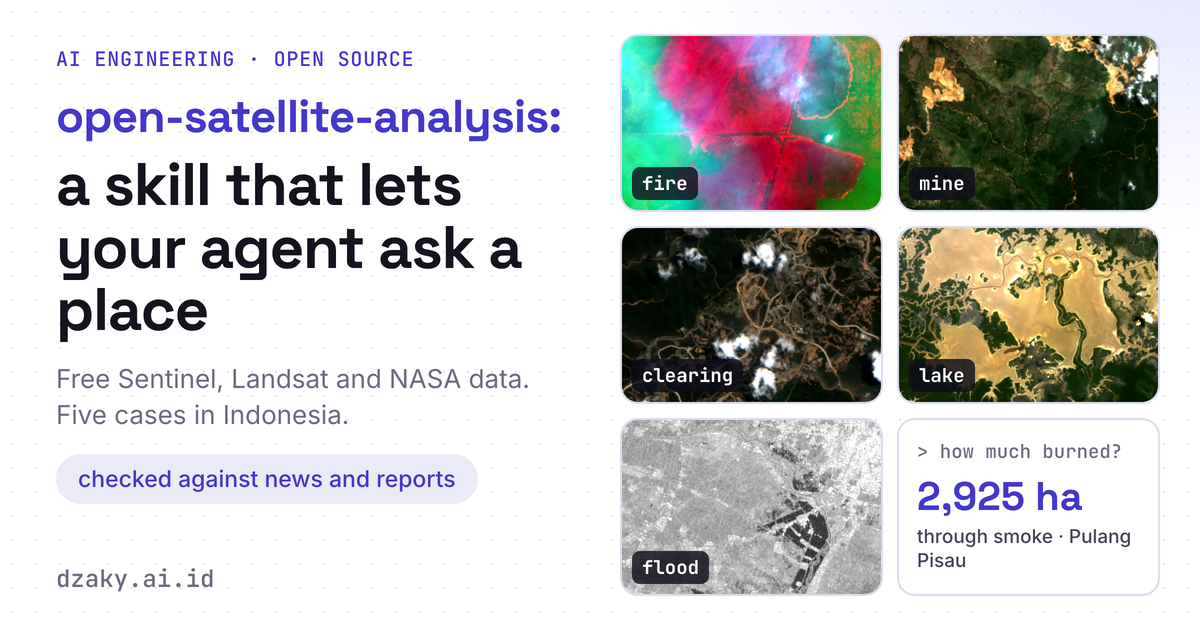
A Satellite Image Full of Smoke
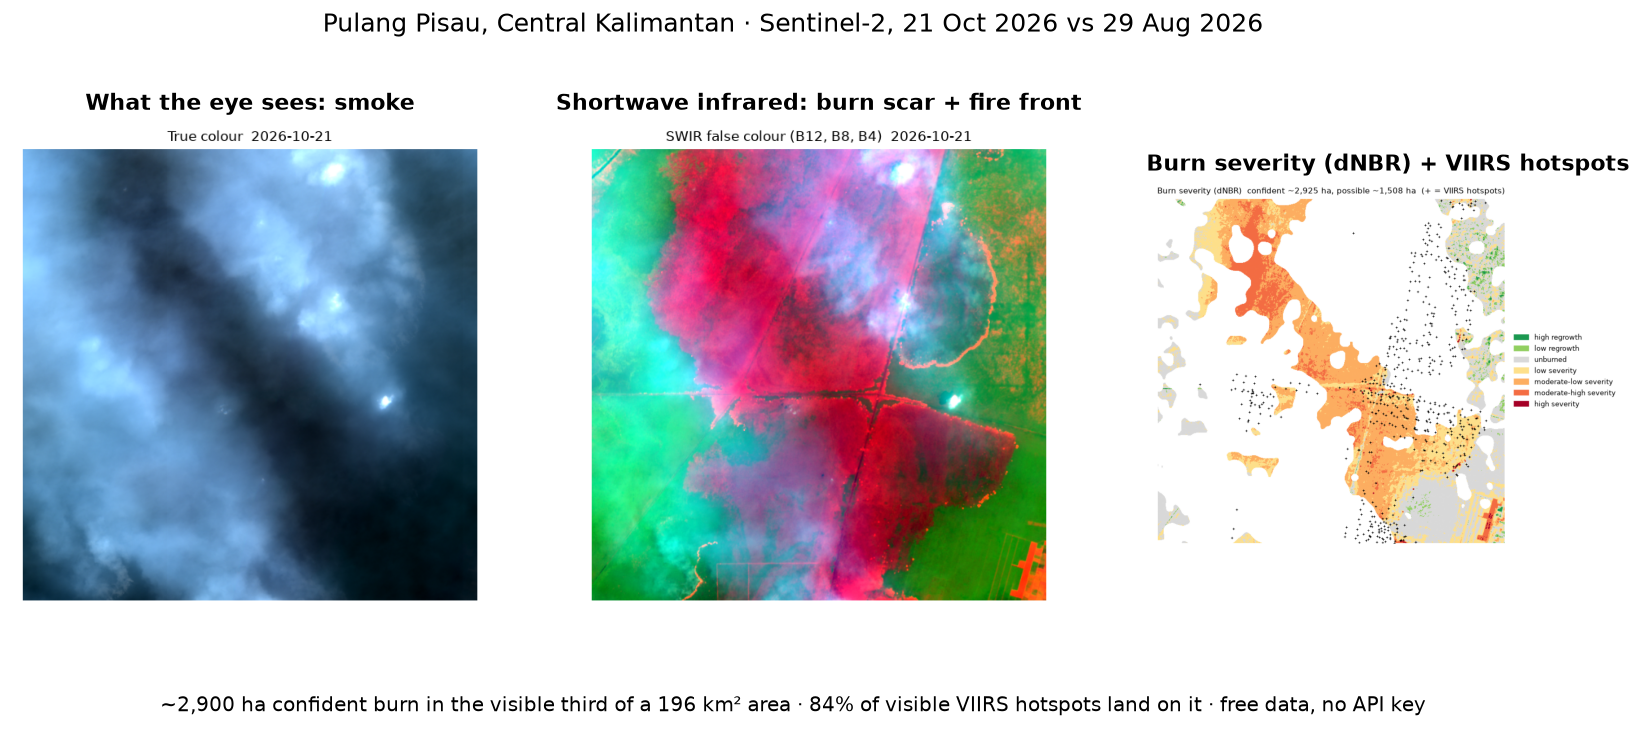
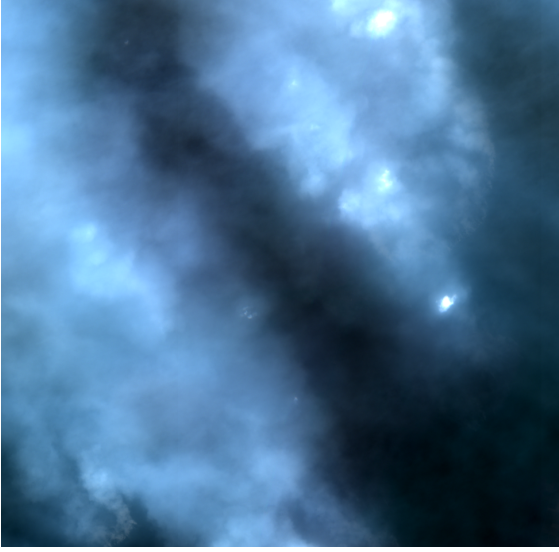
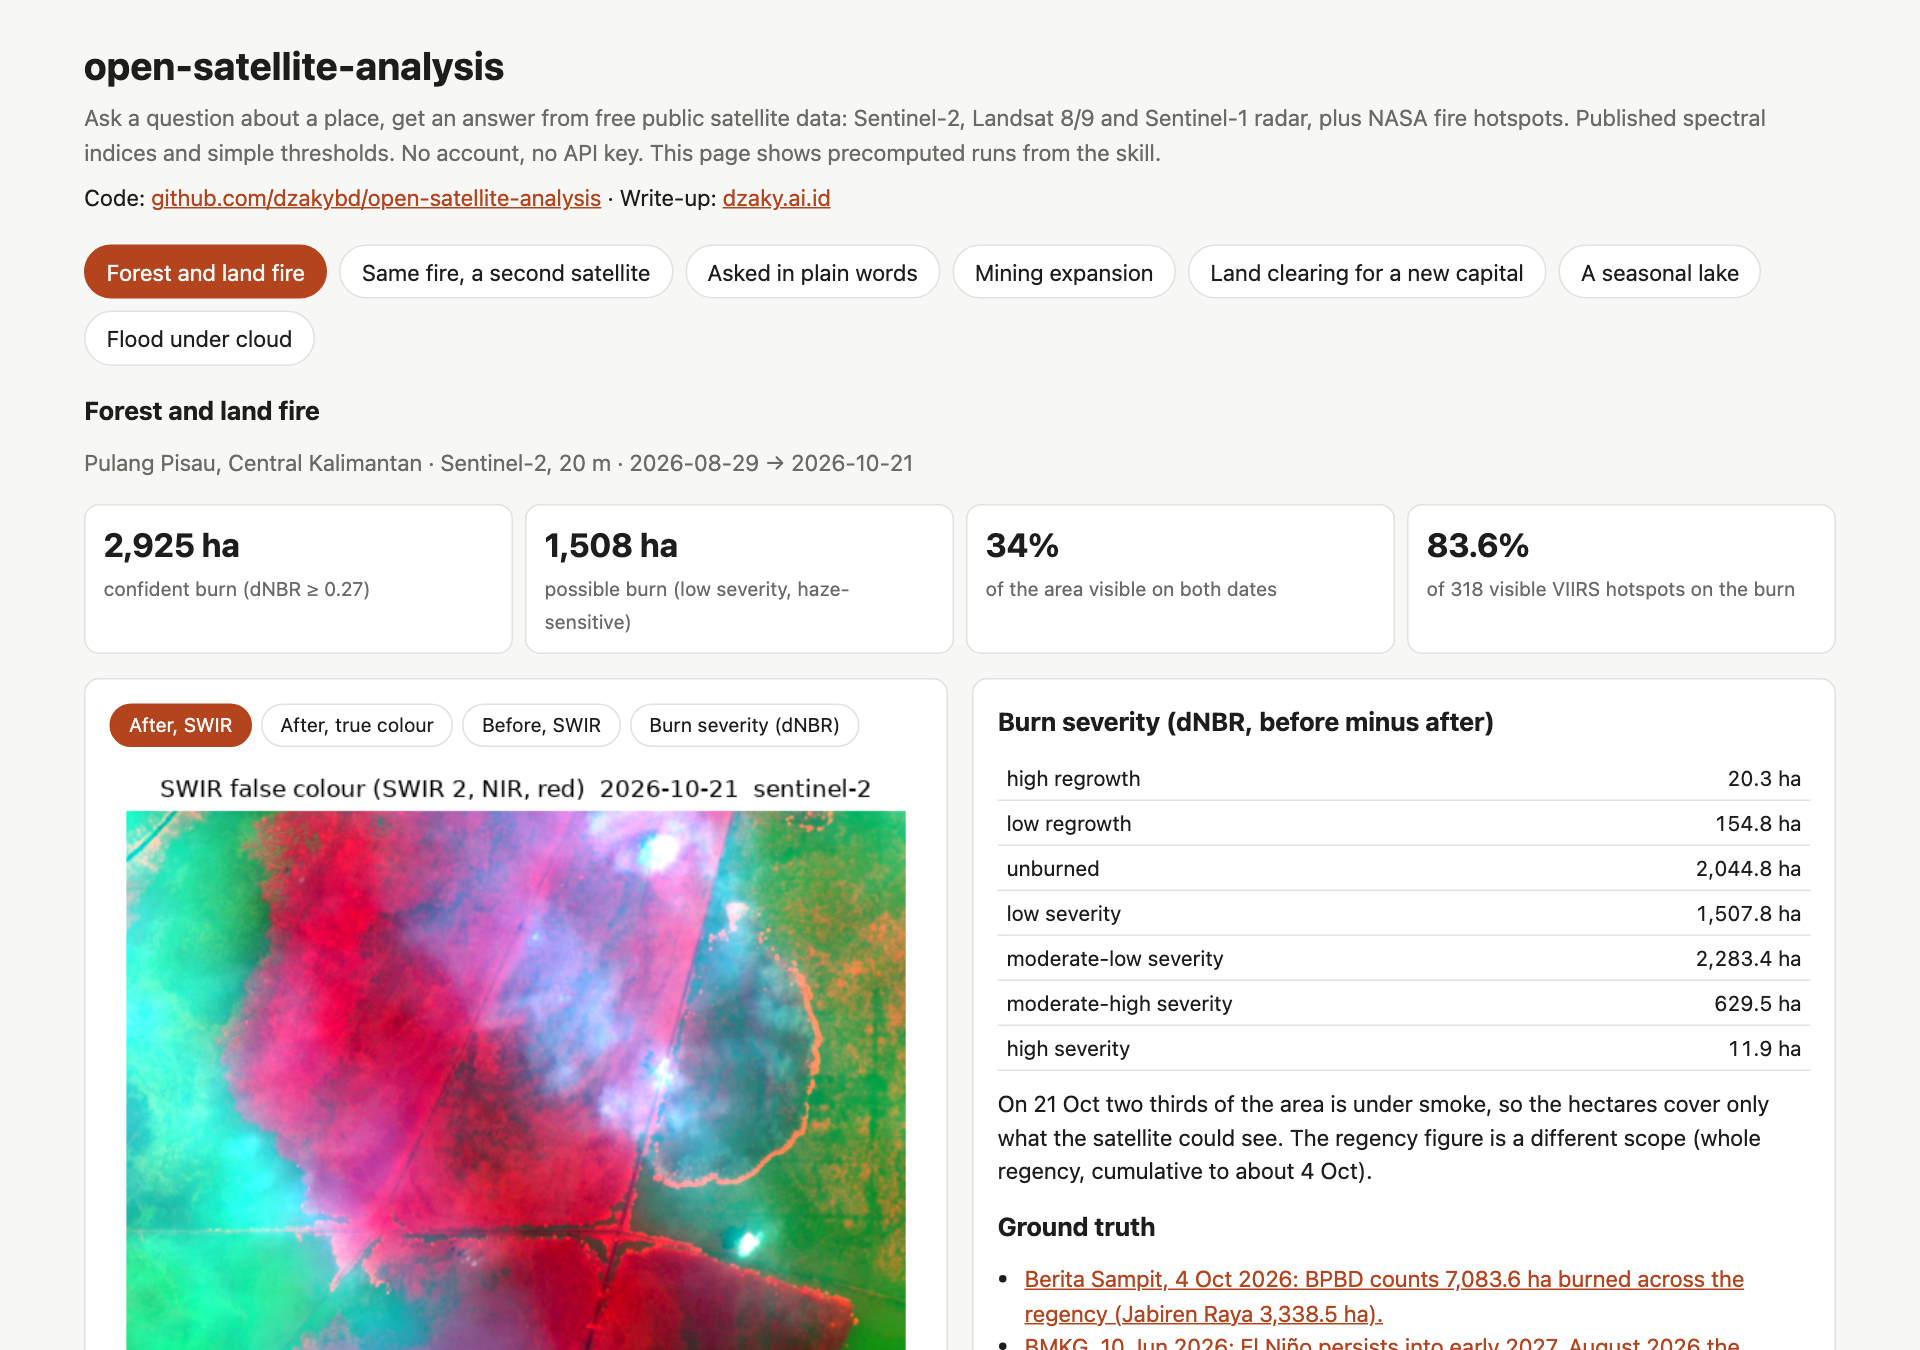
On 21 October 2026, Sentinel-2 passed over Pulang Pisau in Central Kalimantan, in a week when NASA's VIIRS sensors logged about 1,400 fire hotspots inside a single 14 km square there. In true colour, the picture shows nothing but smoke.
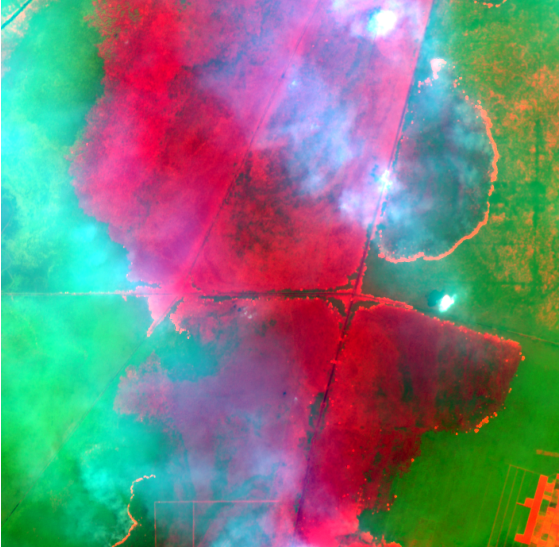
The same pass also recorded shortwave infrared, and in that band the smoke mostly disappears. What shows instead is a burn scar several kilometres long and the line of the fire front at its edge.
That image is free. So is everything needed to turn it into a number: the imagery, the index formulas, and NASA's fire detections. What is missing is the glue, the steps between "here is a scene" and "about 2,900 hectares burned, and here is the evidence". Those are the steps where people, and AI agents, go wrong. I built open-satellite-analysis as a skill an agent can pick up, the same pattern as pid-parser: small scripts that do the measuring, and instructions that tell the agent how to use them. Attach it to your agent and you can ask about a place, then get numbers, maps and limits back. I tested it on five questions about places in Indonesia.
Code: github.com/dzakybd/open-satellite-analysis (MIT) · Demo: huggingface.co/spaces/dzakybd/open-satellite-analysis
TL;DR
- What it is: a skill you attach to an agent so it can query and analyse a case from public satellite data. Give it an address or coordinates and a question; it returns numbers, maps and the limits that apply. Two versions, like pid-parser: a skill for coding agents (
npx skills add dzakybd/open-satellite-analysis) and a LangChain Deep Agents version.- How: six small scripts do the work: address to area, the clearest scene for that area, a spectral index, a two-date comparison, NASA hotspots, and a catalog search. The approach is published indices and plain thresholds, so every number can be rerun.
- Free data, no keys: Sentinel-2 (Earth Search), Landsat 8/9 and Sentinel-1 radar (Microsoft Planetary Computer), NASA FIRMS hotspots, OpenStreetMap geocoding, and 245 indices from the Awesome Spectral Indices catalog, computed with spyndex.
- How well: five Indonesian cases, each checked against news and reports. The October 2026 Pulang Pisau fires came out at about 2,900 ha from Sentinel-2 and 4,000 ha from Landsat, with 84% of the visible NASA hotspots on the burn.
- Where it is weak: smoke hides the ground for weeks at the peak of fires, radar misses water under crops and buildings, and 20 to 30 m pixels miss small changes.
What It Is Useful For
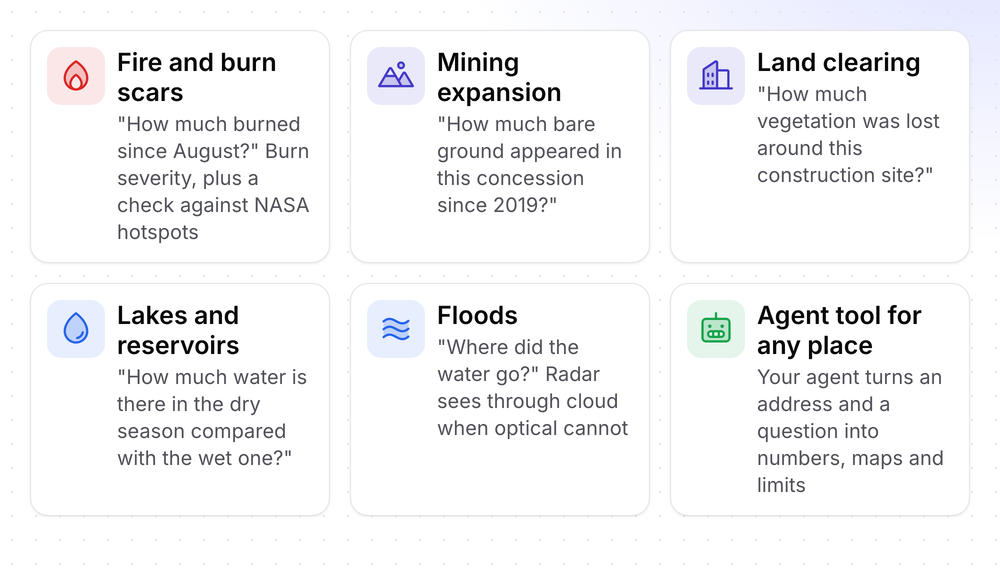
Anything that starts with "what changed at this place?" and can be seen from orbit. I tested the five on the first row of cards below; the sixth is the point of the skill, which is to give an agent these questions as a tool.
How It Works, Step by Step
The skill is a folder: a SKILL.md with the instructions, and standalone scripts that run with uv run and install their own dependencies. The agent reads the instructions, picks the scripts, runs them and reads the output. Two of the choices are the agent's own, guided by SKILL.md: which satellite fits the question, and which index fits the use case.
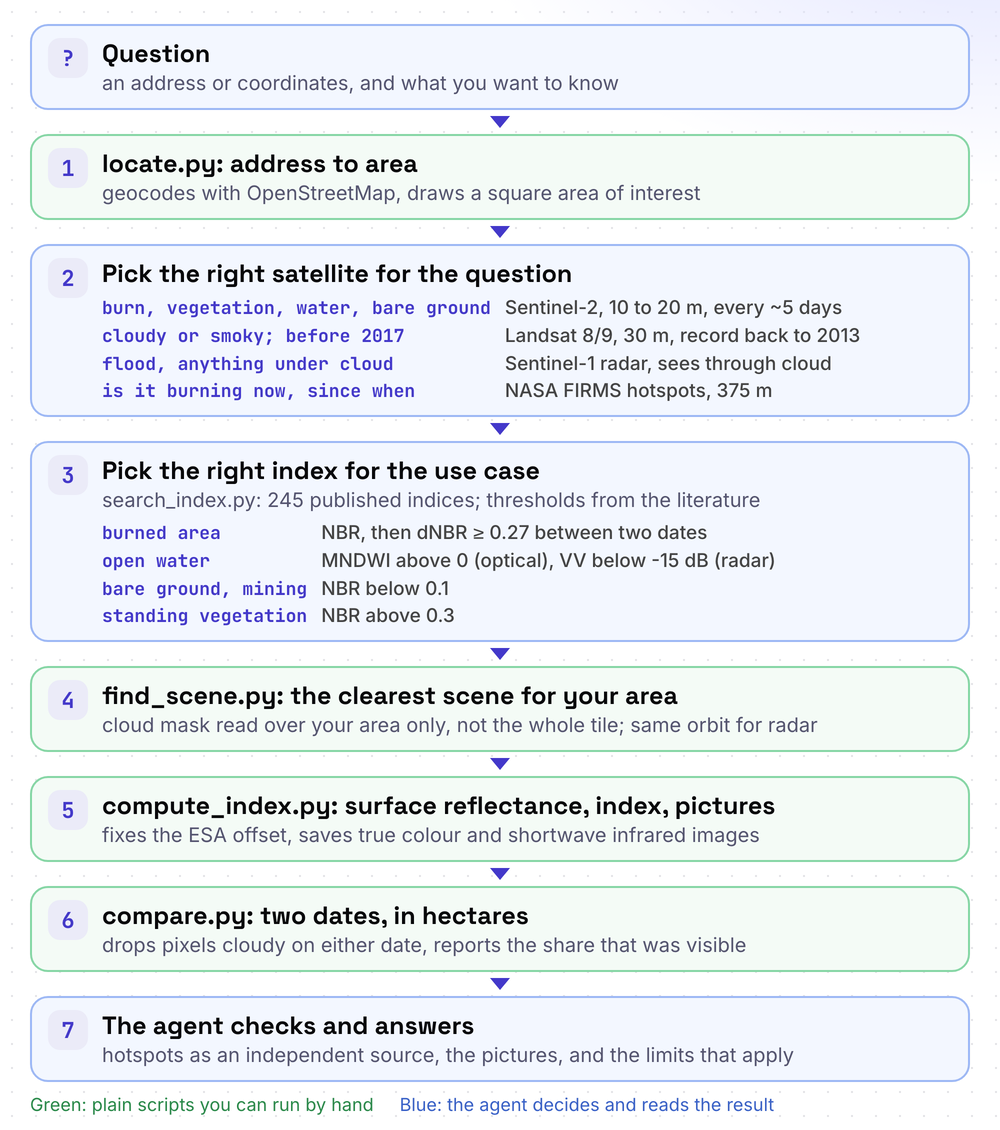
1. Pin the place. locate.py turns an address into coordinates with OpenStreetMap's Nominatim, or takes coordinates directly, and draws a square area of interest (AOI) around them.
uv run locate.py --lat -2.8 --lng 114.05 --buffer-m 7000 --out work/aoi.json
uv run locate.py "Pulang Pisau, Kalimantan Tengah" --buffer-m 3000 --out work/aoi.json
2. Pick the index. A spectral index combines bands to highlight one thing. NBR, the Normalized Burn Ratio, uses near-infrared, which healthy leaves reflect strongly, and shortwave infrared, which bare and charred ground reflects strongly: (NIR − SWIR2) / (NIR + SWIR2). When vegetation burns, NBR drops. search_index.py lists the 245 indices that Sentinel-2 can compute, or the ones Landsat can. The Awesome Spectral Indices catalog lists 280 of them with their bands and source papers, and spyndex computes them. I wrote none of the formulas.
uv run search_index.py --domain burnWhy the catalog's band names need care. The catalog names bands generically: N is near-infrared, S1 and S2 are the two shortwave bands. So in NBR's formula S2 means SWIR 2 (band B12), not Sentinel-2. The skill spells that out, because an agent will confuse them.
3. Find a clear scene, for your area. Sentinel-2 images the same place about every five days, and each scene comes with a cloud percentage. That number is for the whole 110 km tile. find_scene.py instead reads the cloud mask for your AOI only.
uv run find_scene.py work/aoi.json --out work/post/scene.json                       # latest clear scene
uv run find_scene.py work/aoi.json --date 2026-08-29 --direction before --out work/pre/scene.json
uv run find_scene.py work/aoi.json --source landsat --out work/post-landsat/scene.json
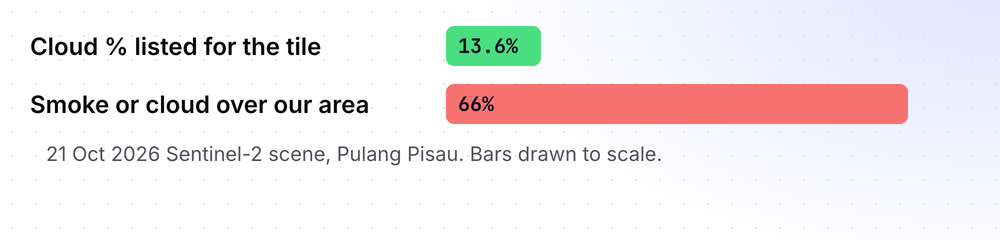
It matters: the 21 October scene over Pulang Pisau is listed at 13.6% cloud, but over our area 66% was smoke or cloud, because the smoke sits exactly where the fires are. The script prints both numbers, and the scenes it skipped.
4. Compute. compute_index.py reads only the pixels of the AOI from the cloud-optimized files, converts to surface reflectance, and computes the index. It also saves a true-colour picture and a shortwave-infrared false colour, where burn scars are dark red.
uv run compute_index.py work/aoi.json work/post/scene.json NBR NDVI --out work/postSame scene, two pictures. The true colour is what the eye sees; the shortwave-infrared one is what the index uses.
Why the reflectance step nearly broke everything. Since 2022, ESA adds 1000 to every Sentinel-2 L2A value, and the metadata says to subtract it. Earth Search already removes it from the pixels and marks the item earthsearch:boa_offset_applied, but the metadata still lists the offset. My first run applied it again: shortwave values went negative and healthy forest came out at NDVI −0.99. A second bug made it worse: the visual asset, an 8-bit RGB picture, also claims to be bands 2, 3 and 4, and was read as red. Both are fixed and written into the skill, so an agent does not repeat them.
5. Compare two dates. compare.py has three modes: dNBR burn severity, "how much is above or below a threshold on each date" (water, vegetation, bare ground), and a plain change map. Pixels that are cloudy on either date are left out, and the share left out is reported with every result.
# burn severity, with a hotspot check
uv run hotspots.py --aoi work/aoi.json --days 7 --out work/hotspots.json
uv run compare.py work/pre/NBR.tif work/post/NBR.tif --burn \
  --hotspots work/hotspots.json --out work/compare

# water, bare ground, vegetation
uv run compare.py work/dry/MNDWI.tif work/wet/MNDWI.tif --above 0 --out work/compare
uv run compare.py work/2019/NBR.tif work/2026/NBR.tif --below 0.1 --out work/compare
The result is a summary.json and a map. This is the one for Pulang Pisau:
{
  "mode": "dNBR (pre - post)",
  "confident_burned_hectares": 2924.8,
  "possible_burned_hectares": 1507.8,
  "aoi_hectares": 19601.5,
  "compared_pct": 33.9,
  "note": "Pixels cloudy, shadowed or missing on either date are excluded (see compared_pct)."
}
6. The agent checks and answers. The scripts return numbers; SKILL.md tells the agent what to do with them: quote the share of the area that was visible, say which classes are uncertain, look at the pictures before trusting a scene taken during a fire, check hotspots as an independent source, and say that an index change shows that the surface changed, not why.
The measurements come from published ingredients only: spectral indices, the cloud masks that ship with the imagery, and plain thresholds taken from the literature (water is dark in radar below about -15 dB, burned ground has a dNBR above 0.27) and stated next to every result. Nothing is trained, so anyone can rerun a number and get the same one. What I built is the pipeline around the indices, where most of the errors in this kind of analysis happen, as the sections below show.
Which Data for Which Question
No single satellite answers everything. The skill gives the agent this table:
| Question | Source | Why |
|---|---|---|
| Burns, vegetation, water, bare ground | Sentinel-2, 10 to 20 m, every ~5 days | Finest free optical imagery, 245 indices |
| Sentinel-2 is cloudy or smoky; history before 2017 | Landsat 8/9, 30 m, every ~8 days | Different overpass days, record back to 2013 |
| Is it burning now? When did it start? | NASA FIRMS hotspots, 375 m, several passes a day | Sees heat through smoke, but too coarse to measure area |
| Floods under cloud, anything optical cannot see | Sentinel-1 radar, 10 m | Sees through cloud, smoke and darkness; water is dark |
A note on fire, because it is easy to mix up: the hotspots only say where and when. They are 375 m pixels and cannot tell you how many hectares burned. The hectares in this post come from Sentinel-2 and Landsat, at 20 to 30 m. The hotspots serve as an independent check on those numbers, from a different satellite, a different sensor and a different method.
Results at a Glance
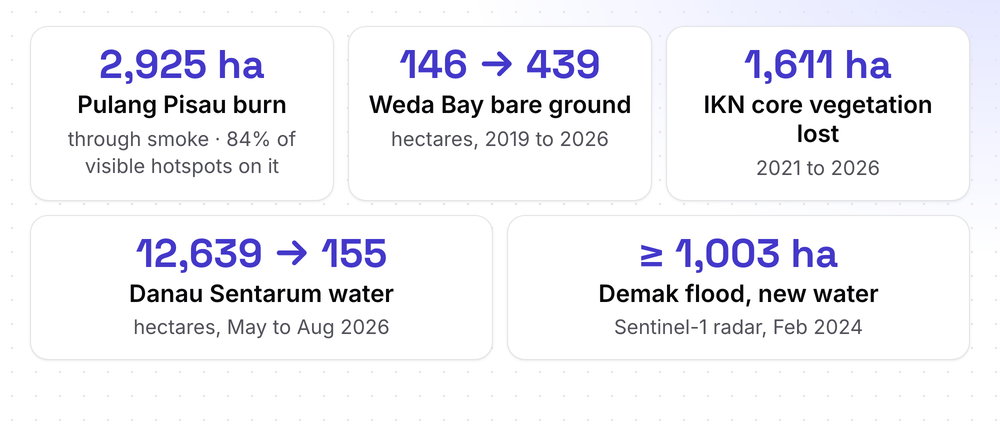
Five questions, five places, every result checked against news and reports. The details, with pictures and ground truth, follow.
| Case | Sources | Result | Visible on both dates | Checked against |
|---|---|---|---|---|
| Pulang Pisau fire, Oct 2026 | Sentinel-2, Landsat, FIRMS | ~2,925 ha (S2), ~4,003 ha (Landsat); 84% of visible hotspots on the burn | 33.9% (S2), 100% (Landsat) | BPBD figure via Berita Sampit |
| Weda Bay mine, 2019 to 2026 | Sentinel-2 | bare ground 146 → 439 ha | 84% | Climate Rights International, Mongabay |
| IKN core, 2021 to 2026 | Sentinel-2 | 1,611 ha of vegetation lost | 69% | Otorita IKN, Forest Watch Indonesia |
| Danau Sentarum, 2026 | Landsat | 12,639 → 155 ha of open water | 77% | Mongabay Indonesia, LIPI |
| Demak flood, Feb 2024 | Sentinel-1 | ≥ 1,003 to 1,281 ha of new open water | same orbit both dates | Media Indonesia, WIKA, Republika |
Five Questions, Five Places
1. How much burned? Pulang Pisau, October 2026
The recipe: NBR on a clear scene before the fires (29 August) and the latest scene (21 October), then dNBR, classified with the USGS FIREMON ranges (Key & Benson, 2006).
| Area | 14 km × 14 km around -2.8, 114.05 (19,602 ha) |
| Before / after | 29 Aug 2026 (clear) / 21 Oct 2026 (66% of the area under smoke or cloud) |
| Visible on both dates | 33.9% |
| Confident burn (dNBR ≥ 0.27) | ~2,925 ha |
| Possible burn (low severity, 0.1 to 0.27) | ~1,508 ha |
| NASA VIIRS hotspots on visible pixels | 266 of 318 (83.6%) within 190 m of a confident burn |
The script reports two areas on purpose. The low-severity class, 0.1 to 0.27, is what haze, drought and harvest also produce, so it is not counted as fire. On my first test site, a hazy scene put 3,600 ha into that class, and the true-colour image showed it was mostly haze.
Ground truth. Berita Sampit reported on 4 October 2026, quoting the regency's disaster agency (BPBD), that 7,083.6 ha had burned across the whole regency, 3,338.5 ha of it in Jabiren Raya (Berita Sampit). BMKG had forecast in June that El Niño would persist into early 2027 and that August 2026 would be the widest dry-season peak (BMKG). The scopes differ, since the official figure covers the whole regency, but the order of magnitude agrees.
A second satellite through the gap. The 21 October view is mostly hidden, so I asked Landsat. Landsat 8 passed on 4 October and its cloud mask flagged none of the area. Against 25 August (Landsat 9):
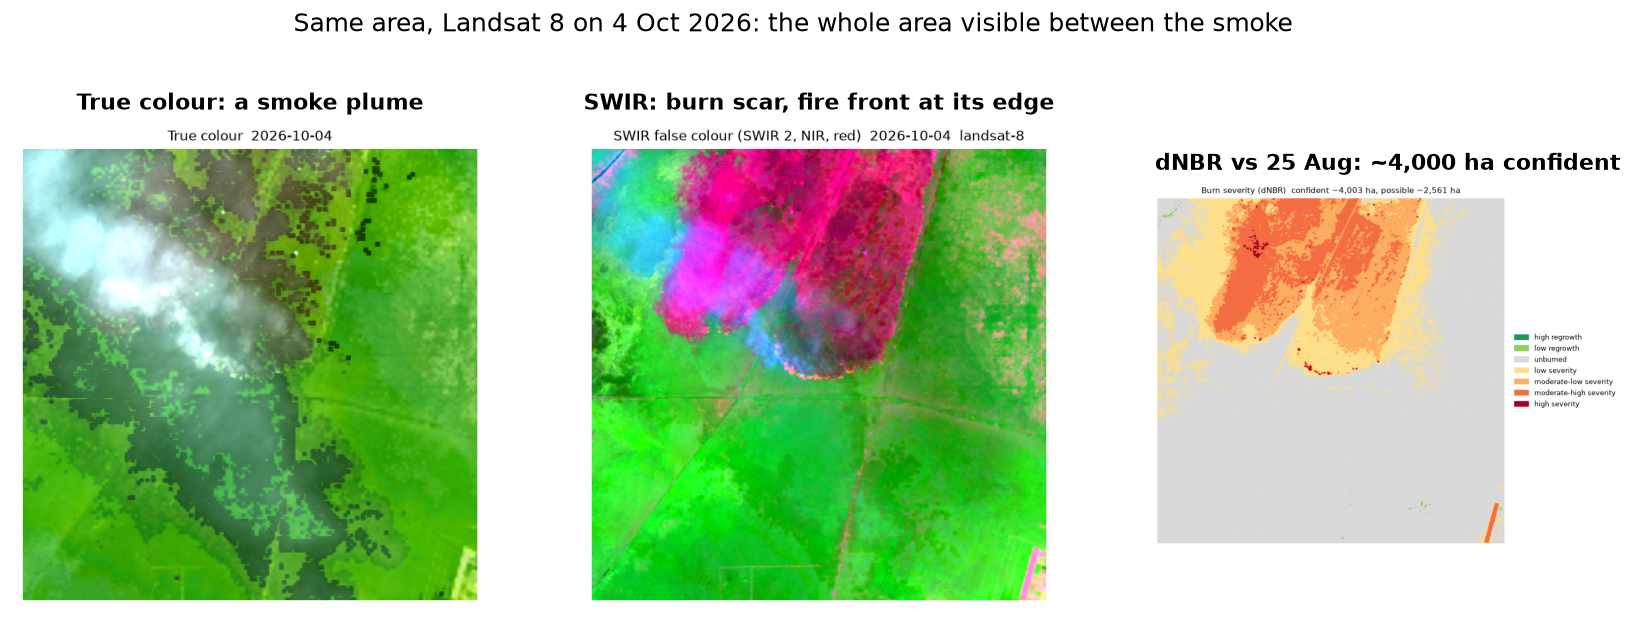
| Landsat 8/9, 30 m | |
|---|---|
| Visible on both dates | 100% of the area |
| Confident burn | ~4,003 ha |
| Possible burn | ~2,561 ha |
The two numbers measure different things: Landsat sees the whole area up to 4 October, Sentinel-2 sees a third of it up to 21 October. The Landsat figure is a little over half of the regency's official 7,083.6 ha reported the same day, which is plausible for a 14 km box inside a regency, though I cannot say more than that. The thin smoke plume is not flagged by Landsat's cloud mask, so pixels under it carry some smoke, which shortwave infrared is the least affected by.
2. How far did the mine spread? Weda Bay, 2019 to 2026
Weda Bay on Halmahera is one of Indonesia's large nickel-mining and processing areas. The recipe: a clear Sentinel-2 scene from July 2019 and one from August 2026, NBR on both, and the area where NBR is below 0.1, which is bare or mined ground.
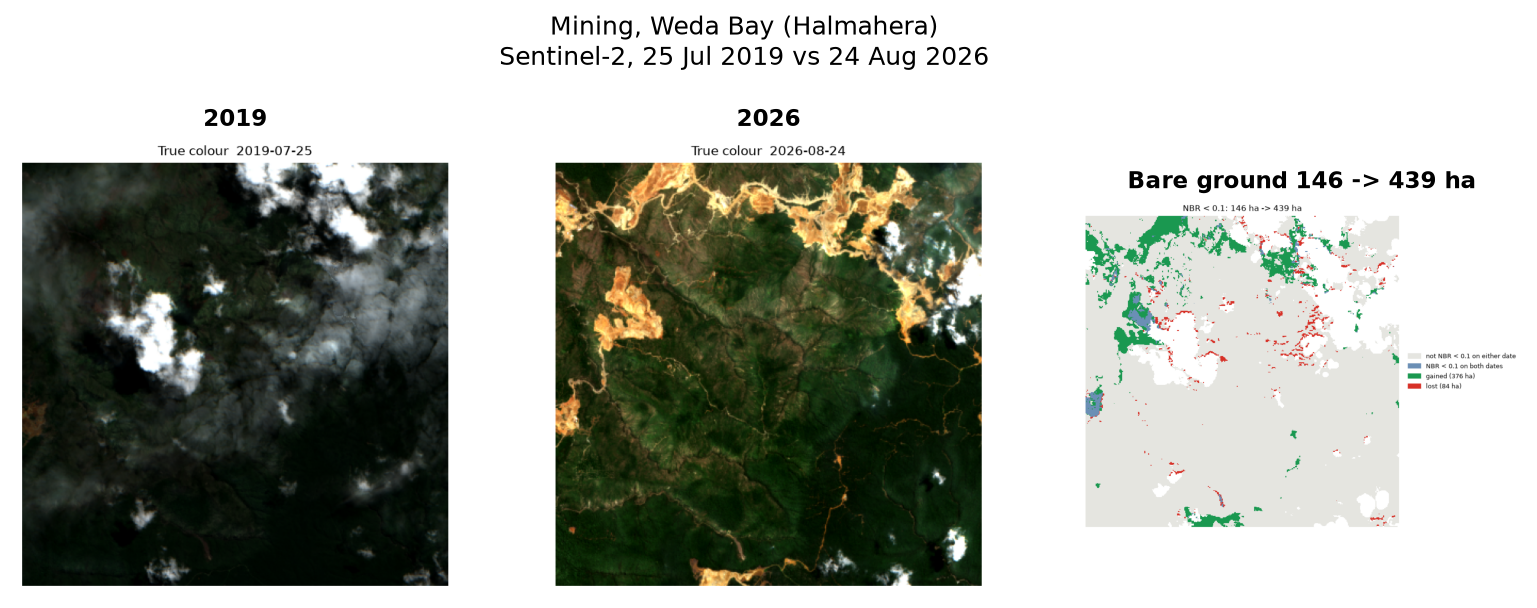
| Area | 8 km × 8 km around Lelilef Sawai (6,351 ha), 84% visible on both dates |
| Bare ground, 2019 | 146 ha |
| Bare ground, 2026 | 439 ha |
| New bare ground / returned to vegetation | 376 ha / 84 ha |
The lesson here was about haze. My first attempt measured vegetation loss with NDVI, and it reported that vegetation had increased around the new pits. The 2019 scene was hazy: thin haze is not flagged as cloud and lowers vegetation indices over forest, so the forest looked greener in 2026 than in 2019. Switching to NBR did not fix it either. What does work is measuring the thing that appears: haze can make forest look dull, but it cannot make forest look like bare ground. Bare ground growing from 146 to 439 ha is the same trend at three different thresholds, and the orange scars in the 2026 image sit exactly where the map says. The skill now says so, in the instructions an agent reads.
Ground truth. Climate Rights International reported in January 2024, from satellite analysis with UC Berkeley researchers, that at least 5,331 ha had been cleared inside nickel concessions on Halmahera (CRI). Mongabay adds that the Weda Bay Nickel concession alone had lost 1,456 ha as of 2022, and that the industrial park estate is about 5,000 ha (Mongabay). Those figures cover all the concessions on the island, far more than an 8 km box, so they confirm the direction and the setting, not my number.
3. How much was cleared for a capital? IKN, 2021 to 2026
Nusantara, Indonesia's new capital in Sepaku, East Kalimantan, started construction in 2022. I took the Central Government Core Area (KIPP) and compared June 2021 with September 2026, counting standing vegetation as NBR above 0.3.
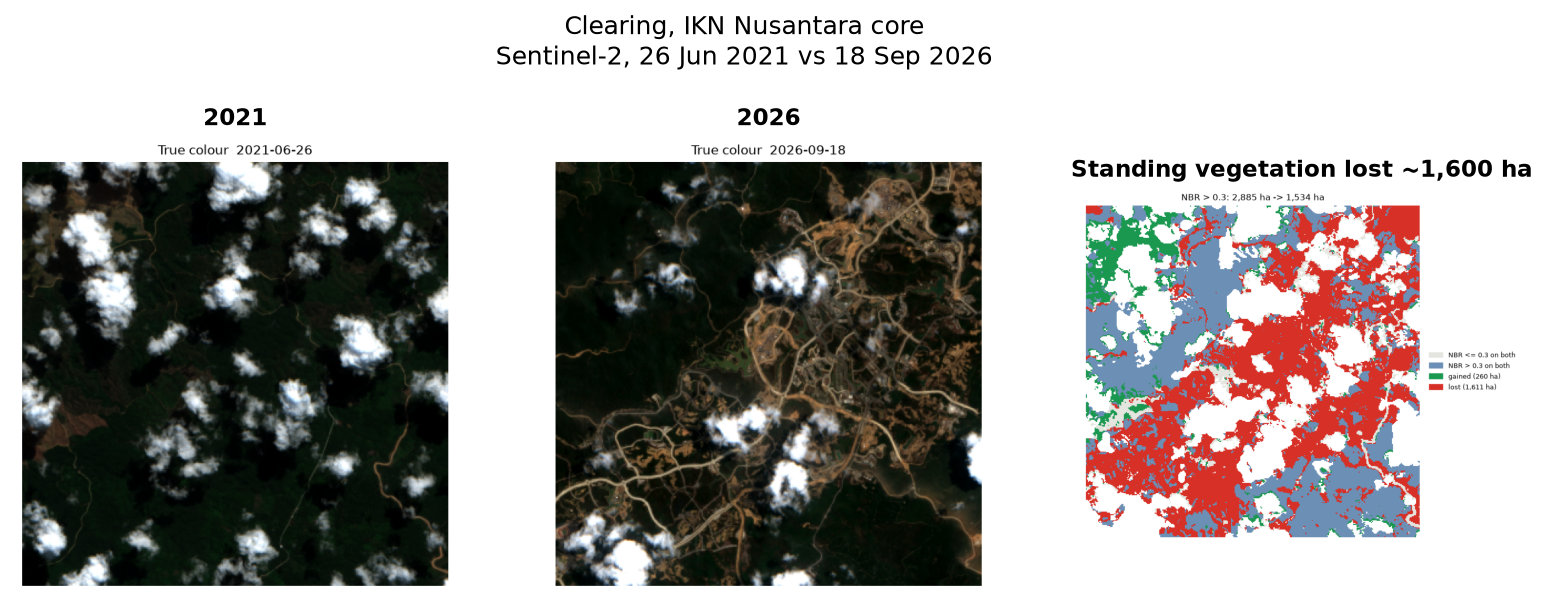
| Area | 7 km × 7 km around the core area (4,869 ha), 69% visible on both dates |
| Standing vegetation, 2021 / 2026 | 2,885 ha / 1,534 ha |
| Lost / regrown | 1,611 ha / 260 ha |
Ground truth. The core area is 6,671 ha (iNews). Kaltimkece reports that Otorita IKN says the land cleared was eucalyptus and oil-palm plantation, not primary forest, and that Forest Watch Indonesia counted 1,663 ha of deforestation between 2022 and June 2023 (Kaltimkece). Two honest caveats follow. My "standing vegetation" includes plantations, so I call it vegetation, not forest. And Forest Watch's figure covers a different area and period, so it is the same order of magnitude as mine, not a match.
4. How much water is in the lake? Danau Sentarum
Danau Sentarum in West Kalimantan is a seasonal lake: flooded about nine or ten months a year and largely dry from July to September. It is the cleanest test of a water index, because the answer is obvious from the pictures. Sentinel-2 failed here (the dry-season scene was hazy), so I used Landsat, which had a clear 7 August view.
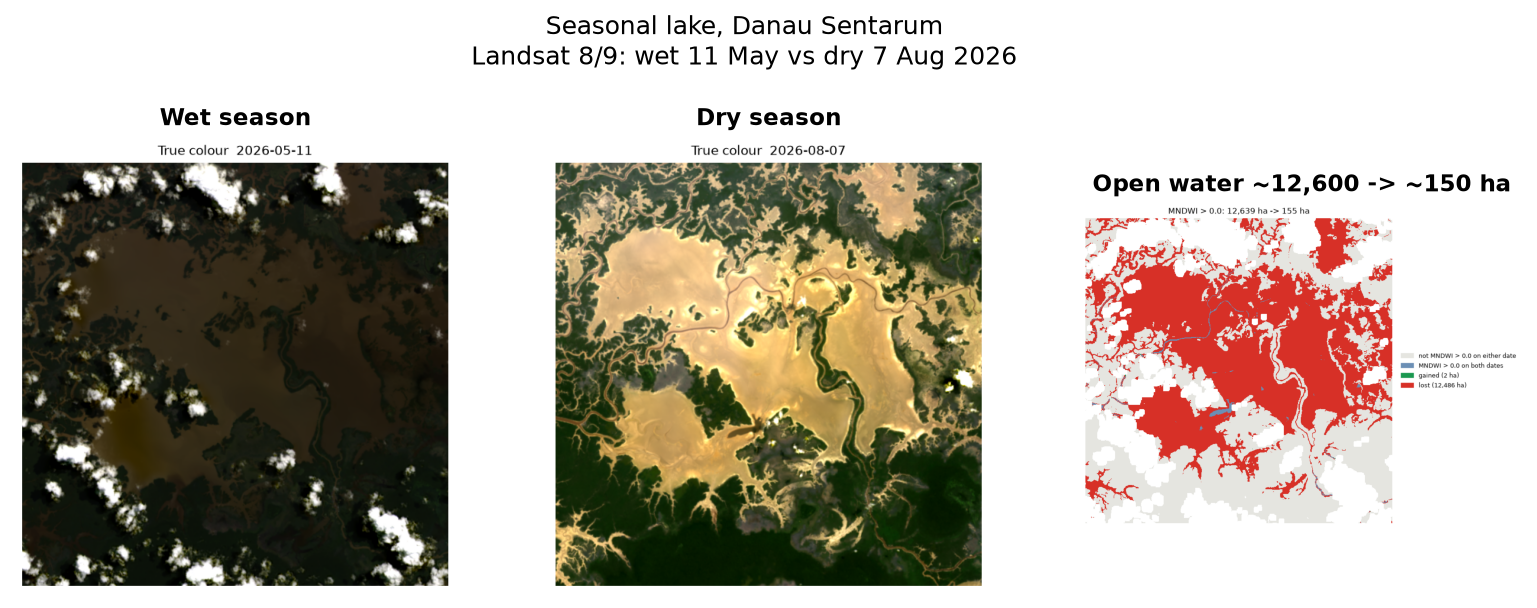
| Landsat 8/9, MNDWI above 0 | |
|---|---|
| Wet season (11 May 2026) | ~12,639 ha |
| Dry season (7 Aug 2026) | ~155 ha |
| Visible on both dates | 77% of the area |
The wet figure is a lower bound: the scene is from May, not February (February was too cloudy), clouds hide part of it, and flooded forest counts as water. The 99% drop between the dates is large enough that none of that changes the conclusion.
Ground truth. Mongabay Indonesia describes the lake as flooded nine to ten months a year and mostly dry in July to September (Mongabay). A LIPI proceeding puts the level change between seasons at 3 to 5 m (LIPI). Both are climatology, not a 2026 observation, and the two sources disagree on the amplitude, so I cite them as context. BMKG expected August 2026 to be the widest dry-season peak, which fits a lake that has nearly vanished.
5. Where did the flood go? Demak, February 2024
For floods, optical satellites are the wrong tool, because floods come with cloud. Sentinel-1 radar sees through it, and open water is dark in radar backscatter. I took two scenes from the same orbit, so the satellite looks at the ground from the same angle: 27 January 2024 (before) and 8 February (during), and mapped where VV backscatter fell below -15 dB.
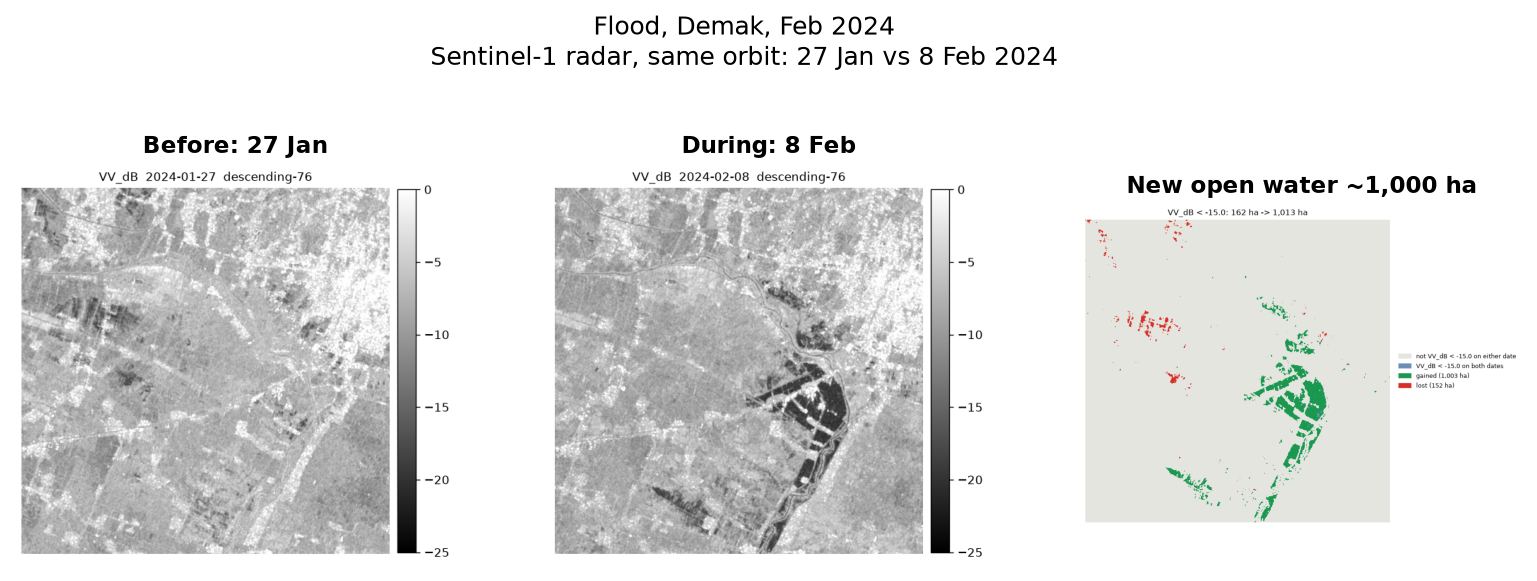
| Area | 18 km × 18 km around Karanganyar (32,192 ha) |
| Open water before / during | 162 ha / 1,013 ha |
| New open water (orbit 76: 27 Jan vs 8 Feb) | 1,003 ha |
| New open water (orbit 127: 19 Jan vs 12 Feb) | 1,281 ha |
Two different orbits, two different dates, and answers of the same size, which is reassuring. But both are lower bounds. Radar reads water under rice, crops, trees and buildings as bright, not dark, so this is open water only, and the real flood was larger.
Ground truth. Media Indonesia reported that the Wulan embankment broke at Ketanjung, Karanganyar, at about 06:00 on 8 February 2024 (Metro TV); the "during" scene was taken at 05:17 on 9 February local time, about 23 hours later. WIKA closed the two breaches between 11 and 14 February (WIKA). Republika, from Antara, reported a preliminary 1,400 ha of rice flooded by 9 February (Republika), and Mongabay Indonesia counted 84,270 people affected and 22,860 displaced (Mongabay). No official flood-extent figure in hectares exists that I could find, so I can only say my number is the right size for what was reported, not that it matches it.
Asking a Deep Agent
The scripts are the same whether a person runs them or an agent does. The LangChain Deep Agents version loads the same SKILL.md, so a fix to the skill reaches both. It runs on a ChatGPT subscription through the sign in with ChatGPT provider, so no API key is needed.
git clone https://github.com/dzakybd/open-satellite-analysis
cd open-satellite-analysis && uv sync

# once: sign in with your ChatGPT account
uv run python -c "from langchain_openai.chatgpt_oauth \
  import login_chatgpt; login_chatgpt()"

uv run python agent/run.py runs/pulangpisau \
  "How much land burned this fire season within about 7 km of -2.8, 114.05 in Pulang Pisau, Central Kalimantan, since the end of August 2026? Check the burn map against this week's fire hotspots." \
  --effort low
The core of agent/run.py is short. Simplified:
from deepagents import create_deep_agent
from deepagents.backends import LocalShellBackend
from langchain_openai.chat_models.codex import _ChatOpenAICodex

model = _ChatOpenAICodex(model="gpt-6-luna", reasoning={"effort": "low"})
agent = create_deep_agent(
    model=model,
    system_prompt=SYSTEM,
    skills=["work/skills"],  # finds skills/open-satellite-analysis/SKILL.md
    backend=LocalShellBackend(root_dir="work", virtual_mode=False),
)
agent.invoke({"messages": [{"role": "user", "content": question}]})
First run: an honest answer to the wrong question. The agent (gpt-6-luna, low reasoning effort) returned 177 ha, with nearly the whole area visible. It had searched forward from 31 August for the first clear scene and found 11 September, weeks before the October fires. To its credit, it said the hotspots fell outside its comparison dates. The skill had said "take the latest scene that shows the area", which an agent can read either way.
The fix was a few lines of instructions and one line of output. The skill now says: search the "after" image back from today with a looser cloud limit, never forward from the start date. And find_scene.py now prints the newer scenes it skipped for cloud, so the trade-off is on screen.
Second run, same question:
About 2,925 ha of confident burn signal from 29 Aug to 21 Oct 2026, plus 1,508 ha of lower-severity change that is less certain. Only 33.9% of the area was visible on both dates, so these figures apply to the comparable portion, not the full area. Of 504 hotspots between the scene dates on jointly visible pixels, 424 (84.1%) were within 190 m of a confident-burn pixel.
That matches the run by hand to the hectare. It took 272 seconds, 7 tool calls and about 47K input tokens. The lesson is the same one as in pid-parser: what makes the agent reliable is not a bigger model but scripts that do the measuring and instructions that leave no room for the wrong reading.
What the Smoke Hides
About 50 km from the Pulang Pisau box, around the densest hotspot cell of the week (2,226 detections in seven days), the optical approach mostly fails, and that is worth showing too. From mid-September to 24 October, every Sentinel-2 scene of that tile reports 96 to 100% cloud, except one hazy pass on 1 October. The fires produce their own blanket.
That is the honest shape of satellite fire monitoring: the heat sensors see the fire as it burns, and the optical imagery measures the scar once the smoke lifts. A tool that pretends otherwise gives a confident wrong number.
Limits and What I Would Improve Next
- Smoke and haze. At the peak of fires the ground can stay hidden for weeks, and thin haze that no mask catches skews vegetation indices. Landsat on other days and radar help; for change over years, measure the thing that appears, not the thing that disappears.
- Severity classes. FIREMON was calibrated on temperate forests. On tropical peat, where fire burns down into the soil, the classes are relative severity, not a measurement of depth.
- Radar sees only open water. Flooded crops, trees and buildings are missed, so flood hectares are a lower bound.
- Resolution. 20 to 30 m pixels miss changes under about half a hectare.
- Thresholds. NBR 0.3, MNDWI 0 and -15 dB are literature defaults. They shift with season and sensor, which is why every result comes with its pictures.
- Hotspot history. The free FIRMS files cover only the last seven days; older hotspots need a (free) key.
- Attribution. An index change shows that the surface changed, not why or who caused it. The skill says so in every answer.
Try It
- Install the skill:
npx skills add dzakybd/open-satellite-analysis, then ask your agent something like "how much burned around Pulang Pisau since August?" or "did this area flood last week?" - Browse the five cases in the demo Space: pictures, burn severity, numbers and the ground truth, in your browser.
- Read the scripts and the Deep Agents runner: dzakybd/open-satellite-analysis. Everything it touches is free.
If you work with land, water or fire monitoring: which place would you ask about first, and what on it would break this? I would like to know where it would and would not fit.
References
- Montero, D. et al. (2023). A standardized catalogue of spectral indices to advance the use of remote sensing in Earth system research. Scientific Data. (Awesome Spectral Indices, spyndex)
- Key, C. H. & Benson, N. C. (2006). Landscape Assessment: Sampling and Analysis Methods. USDA Forest Service, FIREMON.
- Earth Search, Element 84: STAC API for Sentinel-2 on the AWS Registry of Open Data. Microsoft Planetary Computer: Landsat Collection 2 Level-2 (USGS) and Sentinel-1 RTC. NASA FIRMS: VIIRS 375 m active fire product.
- Copernicus Sentinel data 2019 to 2026, processed by ESA.
- News and reports used as ground truth are linked in each section above. Berita Sampit, BMKG, Climate Rights International, Mongabay, iNews, Kaltimkece, Metro TV (Media Indonesia), WIKA, Republika (Antara) and a 2017 LIPI proceeding.