Telecommunications operator · via Accenture · 2024–2025
Retail Store Network Optimization with Geospatial ML
Data Scientist
Client engagement. Names, data, and identifying details are withheld; the architecture is described at a generalized level.
Problem
The store network had grown over years without a consistent, data-driven way to match store size and staffing to local demand. Some stores sat too close together and were under-used, while some high-demand areas had no coverage.
Approach
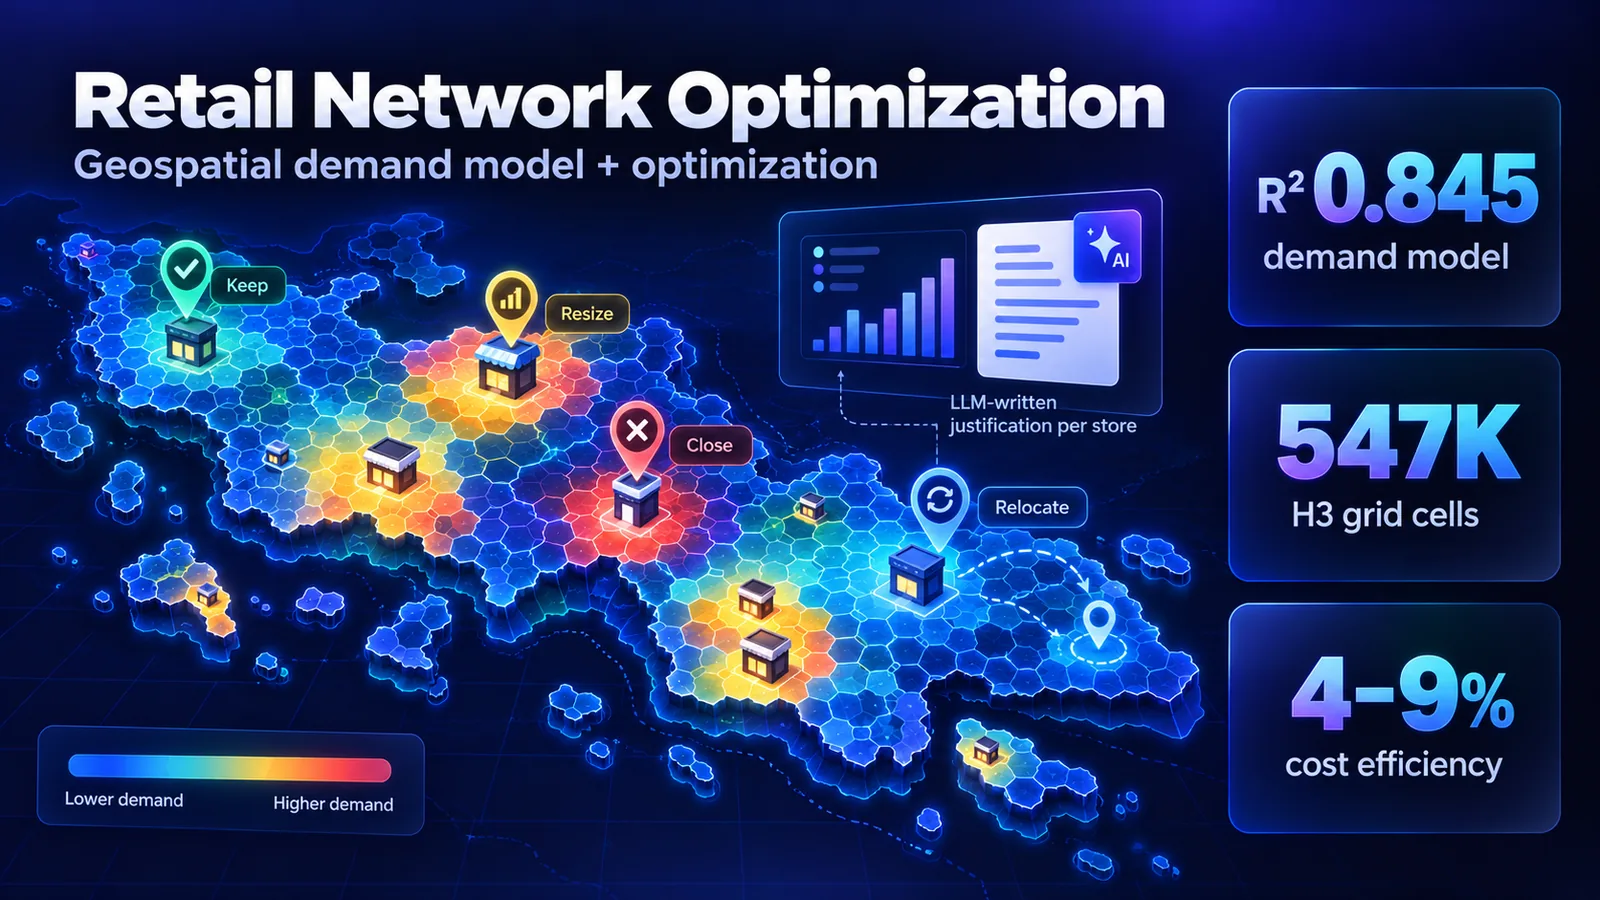
We broke the question into measurable pieces: how far customers actually travel, how close two stores can be before they cannibalize each other, and how much demand each area generates. Those answers fed a demand model, an integer program for the right number of stores per city, and a genetic algorithm that picks an action for every store under cost and coverage constraints.
Architecture
Hover a component to trace its connections · drag to pan · use + / − to zoom
- Source
- Processing
- Model
- Agent / optimizer
- Data store
- Output
How It Works
- Catchment analysisHaversine distance between 2.4M store visits and customers’ home or work locations gave a typical catchment of about 3.3 km.
- Spacing testMann-Whitney U tests on store utilization showed stores within 4 km of a neighbor perform worse, which became the minimum spacing rule.
- Grid featuresSpark and Sedona aggregate customers, points of interest, demographics, and anonymized mobility signals onto H3 hexagons; resolution 8 (~0.74 km²) was chosen through entropy analysis.
- Segment visitorsK-means on PySpark groups store visitors into archetypes, showing how much demand could move to digital and self-service channels.
- Demand modelXGBoost predicts visits per grid cell; an integer program (PuLP) sets how many stores of each size every city needs.
- Optimize actionsA multi-objective genetic algorithm (PyGAD) chooses keep, upsize, downsize, close, or relocate for each store; road-distance routing then resolves near-duplicate stores and sizes staffing.
- Explain & publishAn LLM writes a plain-language justification for each store in a Kubeflow pipeline tracked with MLflow, and results load into PostGIS for the client dashboard.
What I Built
- K-means visitor segmentation on PySpark.
- LLM-generated per-store justifications, orchestrated on Kubeflow with MLflow.
- Contributions to the XGBoost visit-demand model and the network optimization (integer linear programming with PuLP and a multi-objective genetic algorithm).
Impact
The recommendations went to the client as two scenarios worth roughly 4% and 9% in annual cost efficiency while keeping catchment coverage. Decision thresholds were checked against the business’s own past decisions.