Measurements Are the Product
A quantity takeoff turns a drawing into numbers: how many square metres of flooring, how many metres of skirting, how many rooms to paint. Tools that automate it find the rooms in a floor plan and measure them, and their accuracy is usually reported as one number: how well the rooms were found.
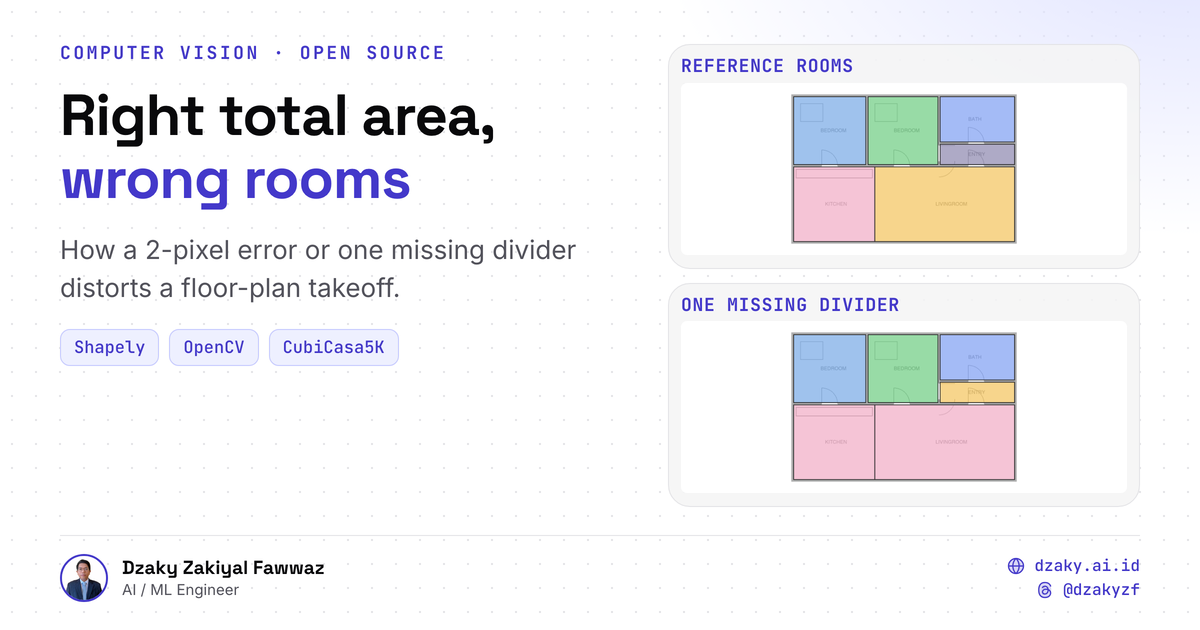
That number can hide the thing a takeoff cares about. A room found 2 pixels too small at every wall can still score as "found", while its area is several percent off. And an error that merges two rooms can leave the total area perfect while every per-room quantity is wrong. I built quantity-lab to measure these effects separately instead of folding them into one score.
Code: github.com/dzakybd/quantity-lab (MIT) · Demo: huggingface.co/spaces/dzakybd/quantity-lab
TL;DR
- What it is: a Python CLI that measures room area, perimeter and count on floor plans in three separate modes. Oracle measures the annotated rooms; controlled errors damage those rooms in known ways; predicted runs a classical OpenCV room finder. Everything is in image pixels.
- Data: three held-out plans from the CubiCasa5K test set (5, 9 and 28 rooms). The room finder was tuned on three train plans only.
- Boundaries: a 2-pixel boundary error changed room areas by 3.3 to 4.1%; 5 pixels by 8.3 to 10.1%. Shifting the whole plan by 5 pixels changed areas by at most 0.2%.
- Counts: one missing divider or one spurious line kept the total area within 0.6%, but the room count went wrong.
- The room finder: matched 0 to 5 rooms per plan (count F1 0.00 to 0.11). On one plan its total area was within 1.3% while it matched no room at all.
Three Modes, Kept Apart
The source of an error decides how to fix it, so quantity-lab never mixes them:
-
Oracle. It measures the annotated room polygons directly. It also pushes them through a raster round trip (draw them into a pixel mask, trace them back) to show what rasterizing alone costs. This proves the measuring code before anything else is blamed.
-
Controlled errors. It takes the oracle rooms and damages them in one known way at a time:
- pull every boundary in, or push it out, by 2 or 5 pixels;
- shift the whole plan;
- scale it by ±2%;
- remove one divider so two rooms merge;
- add one spurious line so a room splits.
Then it measures again.
-
Predicted. A real room finder runs on the drawing, and its rooms are matched to the oracle rooms.
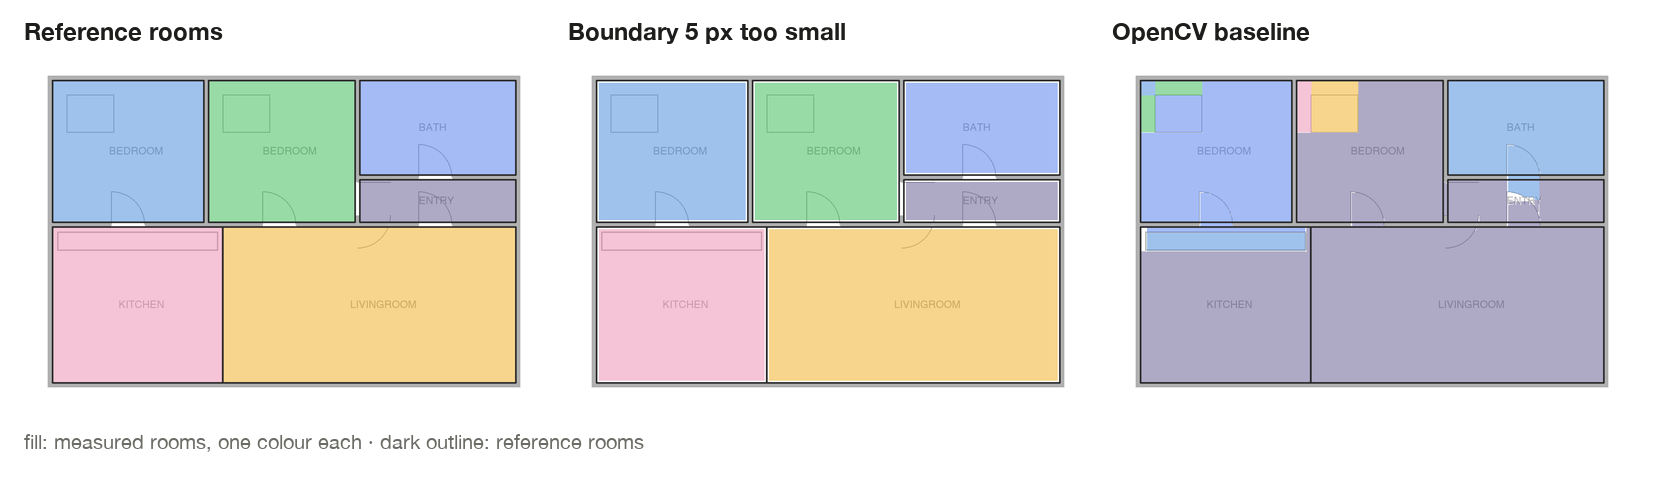
The same synthetic plan in each mode. Coloured fill is what was measured, the dark outline is the reference.
The Data, and What I Did Not Publish
CubiCasa5K is a public set of 5,000 floor plans. Each plan comes with an SVG file that outlines every room, wall, door and window. I took three plans from its test split, picked as simple, medium and dense:
- 5 rooms;
- 9 rooms, where the kitchen and living room share an opening with no wall;
- 28 rooms over two floors.
I skipped two candidates because large parts of their drawings had no annotation, which would have counted real rooms as mistakes.
Three notes on method:
- One PDF route. Each plan image is wrapped in a PDF and read back through the same PDF route a real tool would use. It stays an image inside the PDF, not a vector drawing.
- Pixels only. Everything is measured in pixels. The plans have no verified scale, so I report px and px², never square metres.
- No published images. The dataset is licensed for non-commercial use, so no CubiCasa5K image appears in this post. Every picture is a synthetic plan I made in the same format, and the CubiCasa5K results appear as numbers only.
Is the Measuring Code Right?
Before damaging anything, the oracle checks the ruler. The raster round trip got back every room on all three plans:
- median room-area error 0.12 to 0.36%;
- total area within 0.06%.
The unit tests pin the basics:
- a 10 × 10 square has area 100 and perimeter 40;
- doubling the scale multiplies area by 4;
- moving or rotating a room changes nothing;
- a self-intersecting polygon is repaired and flagged.
Small Boundary Errors
The most common error in any room-finding step is a boundary that sits a little off: a few pixels inside or outside the wall face. Here is what that does to room areas on the three held-out plans.
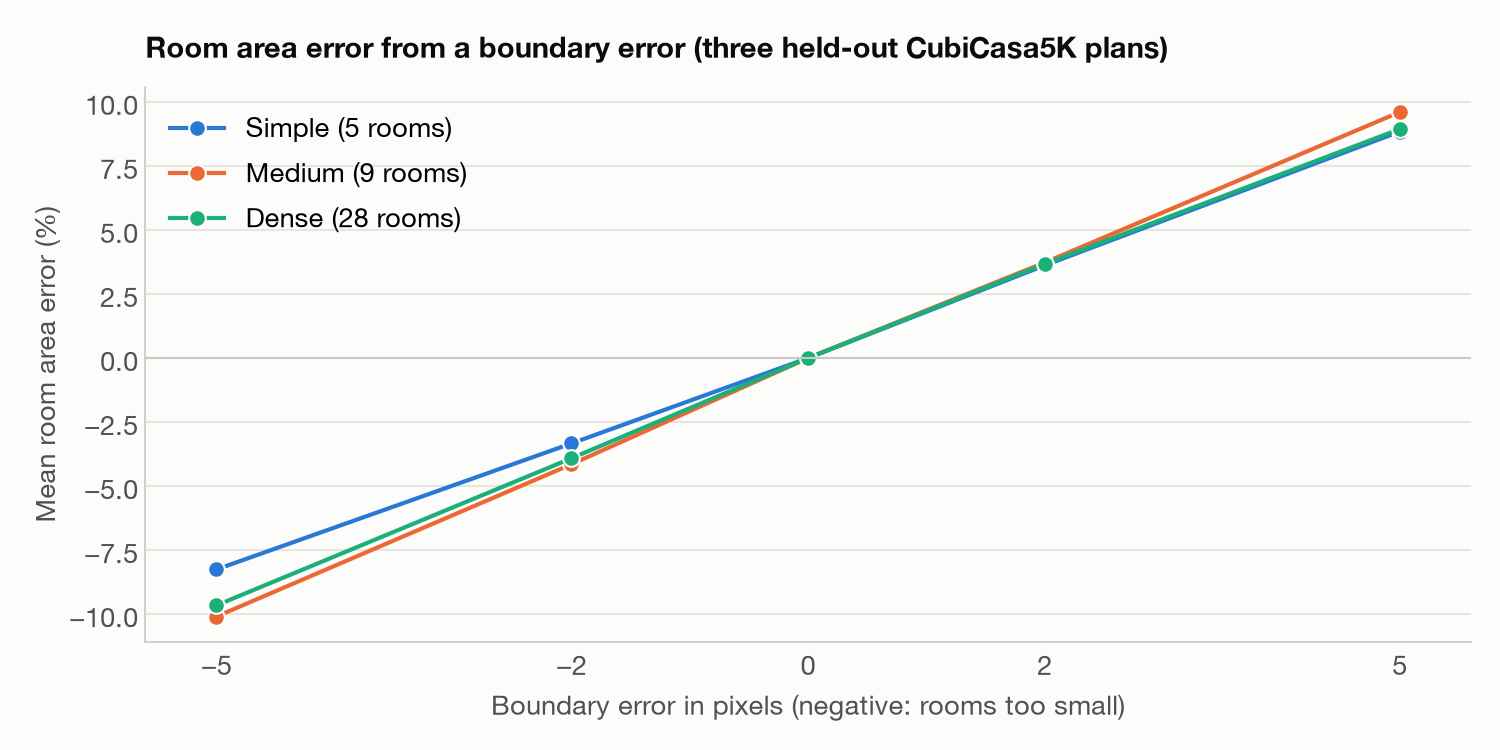
| Error | Room area (simple / medium / dense) | Perimeter | Room count |
|---|---|---|---|
| Boundary 2 px too small | −3.3% / −4.1% / −3.9% | 1.3 to 1.8% | unchanged |
| Boundary 5 px too small | −8.3% / −10.1% / −9.7% | 3.5 to 4.6% | unchanged |
| Boundary 2 px too big | +3.6% / +3.7% / +3.7% | 0.6 to 1.2% | unchanged |
| Boundary 5 px too big | +8.8% / +9.6% / +8.9% | 2.1 to 3.4% | unchanged |
| Whole plan shifted 5 px | +0.2% / −0.1% / 0.0% | ≤ 0.13% | unchanged |
| Scale off by 2% | about ±4% | about 2% | unchanged, except on the dense plan (F1 0.82) |
Mean signed error over the rooms of each plan; the perimeter column is the median absolute error.
Three things stand out:
- Area moves about twice as much as perimeter. Pulling a rectangle's boundary in by d pixels removes about perimeter × d of area, but only 8d of perimeter (2d at each corner). For a roughly square room that works out to about twice the relative change.
- The error grows with the pixel count and hits small rooms hardest. A 2-pixel strip around a closet is a bigger share of the closet than of the living room.
- A shifted plan keeps its areas. Moving everything by 5 pixels barely changes any area, so misregistration ruins overlap scores without hurting the takeoff. A wrong scale does the opposite: 2% of scale is about 4% of area, on every room at once.
Right Total, Wrong Rooms
The second kind of error changes the topology: a divider is missing, or a spurious line cuts a room.
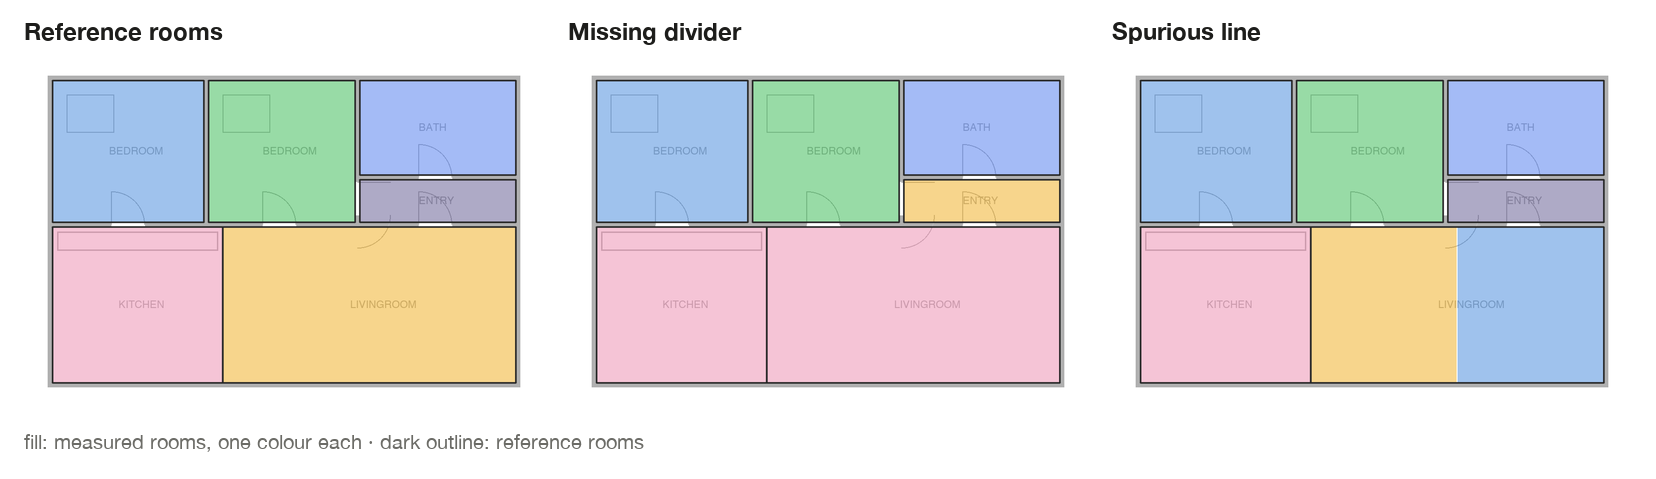
On the held-out plans:
- One missing divider kept the total area within 0.6% and dropped the room-count F1 to 0.89–0.98.
- One spurious line kept the total area within 0.3% and dropped the count F1 to 0.73–0.95.
A takeoff priced by total floor area would not notice either. A takeoff that counts rooms, doors per room, or flooring per room would be wrong. This is the point I most want readers to take away: a correct total is not evidence of correct rooms.
A Real Room Finder
For the predicted mode I used a classical computer-vision baseline, with no trained model:
- dark strokes at least a few pixels thick count as walls;
- gaps between collinear wall pieces are closed as doorways;
- every enclosed region of free space between walls counts as a room.
I tuned its five settings on three CubiCasa5K train plans and froze them before it saw the test plans.
| Plan | Reference rooms | Found | Matched | Count F1 | Total area |
|---|---|---|---|---|---|
| Simple | 5 | 31 | 2 | 0.11 | +33.8% |
| Medium (open kitchen) | 9 | 23 | 0 | 0.00 | −1.3% |
| Dense (two floors) | 28 | 71 | 5 | 0.10 | −4.5% |
It failed as a room counter, and the way it failed matters more than the score:
- It split rooms at furniture, counters and fixture lines: 4 to 10 splits per plan.
- It merged rooms through doorways and the open kitchen. Free space has no way to know where one room ends and the next begins when there is no wall.
- Its settings did not carry over between drawing styles. CubiCasa5K mixes styles: some draw walls as solid dark bands, some in light grey with thin outlines, some as thin double lines. Even on the train plans it reached only 0.33 count F1. On my synthetic plans the doorways, scaled to its working resolution, were wider than the gap it had learned to close, so whole flats became one region.
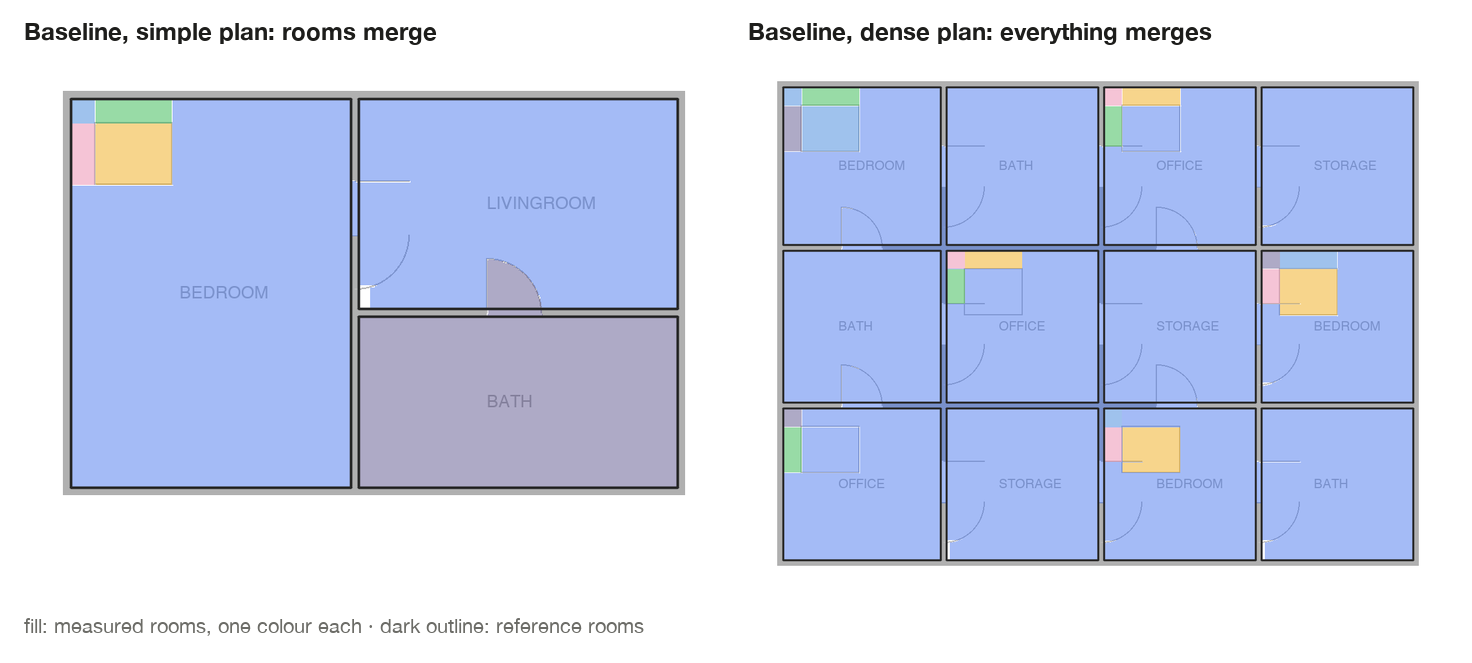
And the medium plan shows the earlier point in the wild: the baseline's total area was within 1.3% while it matched zero rooms. Report only total area and this baseline looks excellent.
What It Means in Practice
- Report per-room errors and counts, not just total area or overlap. Each hides a different failure: overlap hides boundary bias, and totals hide merges and splits.
- Boundary bias is cheap to estimate. Area error is roughly the boundary offset times the perimeter, so a known 2-pixel bias can be corrected, or at least flagged for small rooms.
- Scale is the biggest single lever. A 2% scale error moves every room's area by about 4%. A takeoff needs a verified scale before anything else.
- Free space is not rooms. Open plans and doorways need room separation that walls alone cannot give. That is a job for a trained segmentation model or for explicit rules about openings, and it is where I would take mode C next.
Limits
| Limit | Why it matters | Next step |
|---|---|---|
| Three test plans | Shows how the errors behave, not a general accuracy | Run a larger held-out set by drawing style |
| Pixels, not metres | Real takeoffs need physical units | Read the scale from a scale bar or a dimension line |
| Classical baseline only | Says little about trained models | Add a trained segmentation model for mode C |
| No wall length | The area of a wall polygon is not its length | Add a validated centreline method |
Try It
- Measure a plan:
uv run python -m quantity_lab --input plan.pdf --annotations model.svg --mode oracle --output out/plan(install and options). - Step through the errors on synthetic plans in the showcase Space.
- Rerun the benchmark: the tuning, the error sweep and every result file are in the repo.
If you produce or check takeoffs: which number do you trust first, total area or the room schedule? This experiment says those two can disagree in ways a single accuracy score will not show.
References
- A. Kalervo, J. Ylioinas, M. Häikiö, A. Karhu and J. Kannala, "CubiCasa5K: A Dataset and an Improved Multi-Task Model for Floorplan Image Analysis", SCIA 2019. Data: zenodo.org/records/2613548 (CC BY-NC-SA 4.0); per-file mirror on Kaggle.
- Shapely for polygon measurement and
make_valid, OpenCV for masks and contours, SciPylinear_sum_assignmentfor room matching.