Two Kinds of PDF
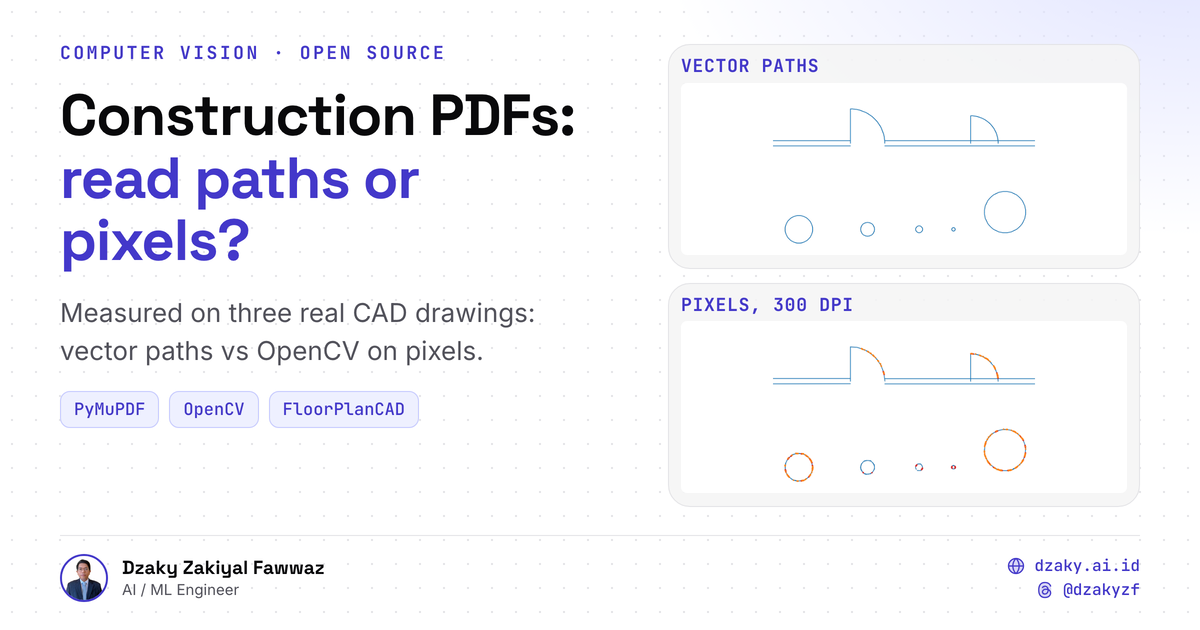
Quantity takeoff, checking a design, and planning work all start from the linework in a drawing: walls, openings, gridlines. Those drawings usually reach you as PDFs, and a PDF comes in one of two kinds. Exported from CAD, it still stores every line as a vector path, with exact coordinates. Scanned or flattened, it is only an image, and the lines have to be found again in the pixels.
So the question is simple: if the PDF still has its paths, do you need computer vision at all? And when the drawing is only pixels, how much do you lose? I built floorplan-parser to answer both with measurements instead of opinions: one tool, two extractors that write the same output, and a benchmark that scores both against the drawing's own geometry.
Code: github.com/dzakybd/floorplan-parser (MIT) · Demo: huggingface.co/spaces/dzakybd/floorplan-parser
TL;DR
- What it is: a Python CLI that pulls line geometry out of a drawing PDF, either by reading the vector paths (PyMuPDF) or by rendering the page and finding lines with classic computer vision (OpenCV threshold and Hough lines). Same JSON, CSV and overlay output either way.
- How it was tested: three held-out FloorPlanCAD drawings (simple, medium, dense), each turned into one vector PDF and image-only PDFs at 150, 300 and 600 DPI, scored by length against the drawing's own SVG geometry. Raster settings were tuned on synthetic drawings only.
- Vector: recovered all the linework on all three (F1 1.000), but every arc came back as dozens of straight pieces: 7,967 pieces for 807 lines on the dense drawing.
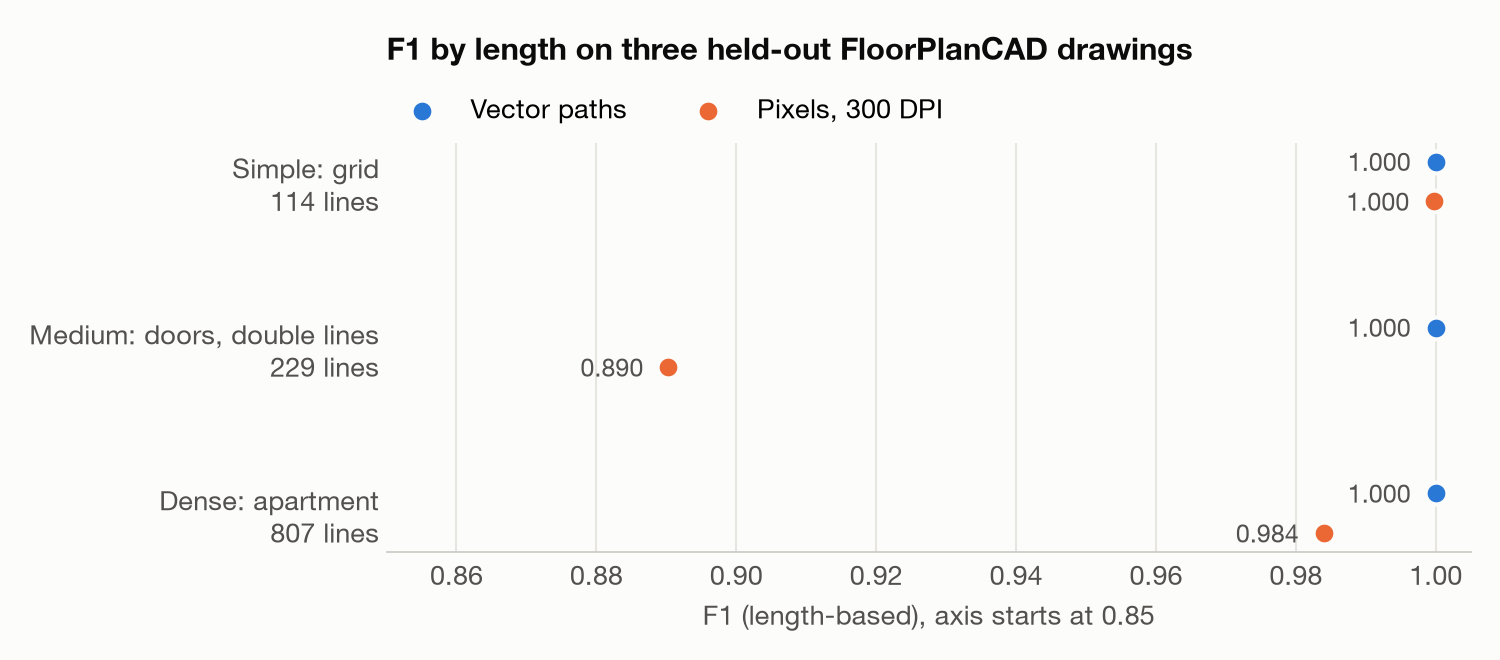
- Pixels: F1 1.000, 0.890 and 0.984 at 300 DPI. Weakest where door panels are drawn as lines under 2 pt apart, where more resolution added more wrong lines, not fewer.
- The honest caveat: the vector PDF is made from the same SVG that scores it, so near-perfect vector numbers are expected. The interesting part is what it still gets wrong, and what pixels cost.
Making the Comparison Fair
A comparison like this is easy to tilt. Feed one method a cleaner input, or tune it on the test drawings, and the result is decided before it runs. So each drawing goes through one pipeline before either method sees it:
- One source. Each drawing starts as an SVG from FloorPlanCAD, a public set of real CAD floor plans.
- No answers in the input. The SVG's labels (which primitive is a wall, a door) and all its text are stripped. It is drawn black on white and scaled to an 800 × 800 pt page.
- Two files from the same page. It is converted once to a vector PDF. That PDF is then rendered to image-only PDFs at 150, 300 and 600 DPI, so the pixel route sees exactly the same drawing.
- The answer key is the drawing itself. Ground truth is the original SVG's lines, arcs and circles in the same coordinates. The labels come back only to split the score by class.
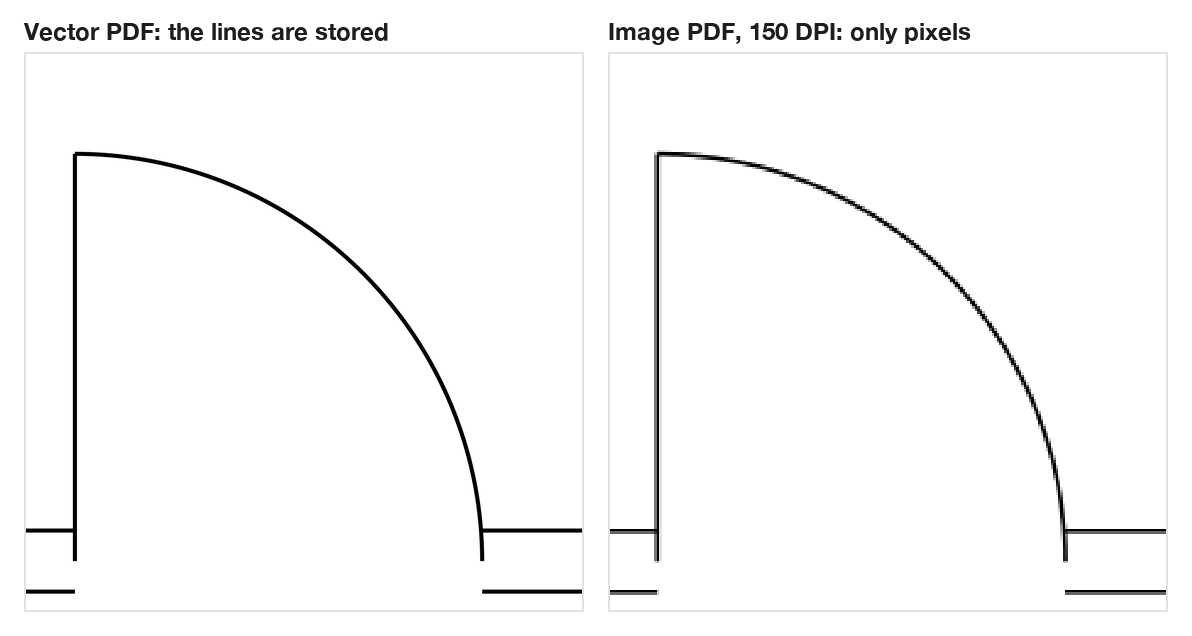
Same page, two files. On the left the arc is stored as geometry; on the right it is only pixels, and the method has to work out where the line was.
A note on the data: the Hugging Face copies of FloorPlanCAD hold PNG images only, with no SVG, so they can't support a vector comparison. I used the original test archive from the project site. Its annotations are licensed for non-commercial use and the authors do not own the drawings, so no FloorPlanCAD drawing appears in this post or anywhere public. Every picture here is a synthetic drawing I made in the same style, and the FloorPlanCAD results appear as numbers only.
The Two Methods
Vector paths. PyMuPDF's page.get_drawings() lists every path on the page: straight lines, Bézier curves, rectangles. floorplan-parser flattens curves into short straight pieces (0.1 pt error), splits rectangles into four edges, and drops duplicates and zero-length lines. Nothing is detected; it is read.
Pixels. The page is rendered, or, if it is one big image, decoded at its own resolution. Then:
- a threshold marks the ink;
- a probabilistic Hough transform (OpenCV's
HoughLinesP) finds straight segments; - broken fragments that lie on the same line are merged.
Lengths in the settings are in points, so one setting means the same physical sizes at every resolution. No neural network and no training: the only tuning is a small grid search over five parameters.
Both write the same elements.json: each line as coordinates in PDF points, with its source box, the page and the method that found it.
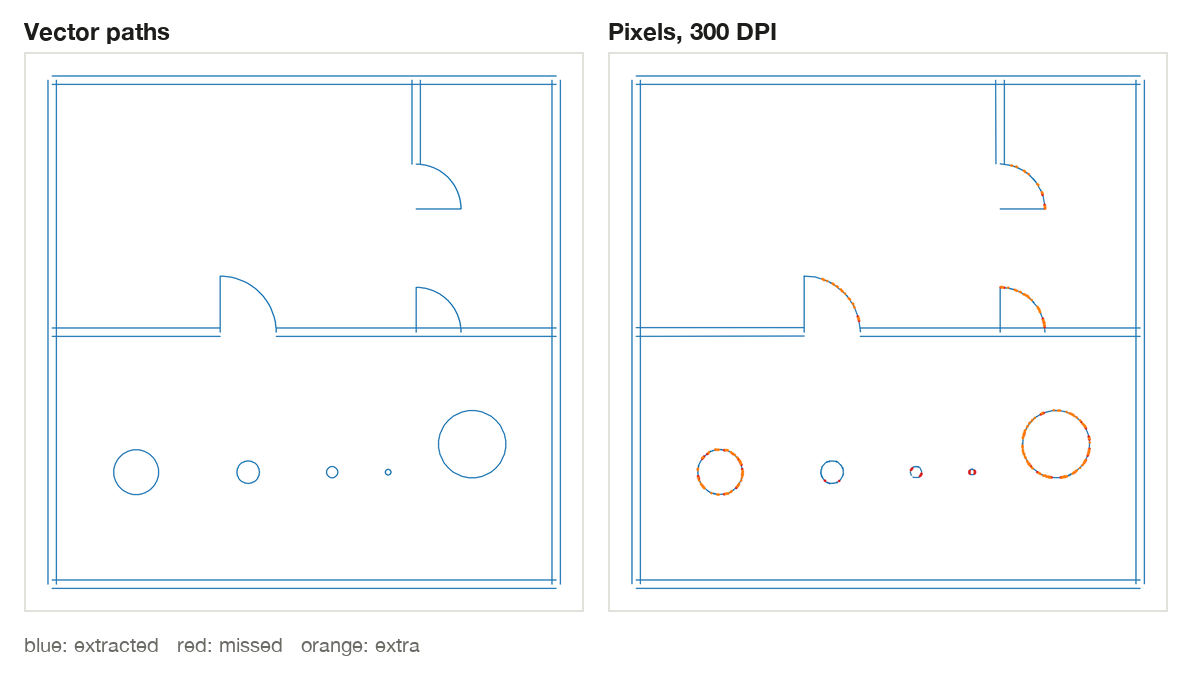
Blue is what each method found, red is linework it missed, orange is linework it added. Pixels return straight segments only, so a circle becomes a ring of chords. Up close, a chord points a little off the curve, and the score counts that as extra.
How It Is Scored
I scored by length, not by counting lines, because the two methods break lines up differently. Both line sets are sampled every 1 pt. Recall is the share of true linework that lies within 2 pt and 5° of an extracted line; precision is the share of extracted linework that lies on a true line. A wall found in 50 pieces scores the same as the wall found whole. Pieces shorter than 4 pt are matched by distance alone, since they are flattened curves and two flattenings disagree on direction piece by piece.
The scorer is tested before it scores anything:
- identical sets score 1.0;
- a line split into 50 pieces still scores 1.0;
- a 3 pt offset scores 0;
- a perpendicular crossing scores under 0.05;
- half a line scores recall 0.5.
The raster settings were tuned on five synthetic drawings and frozen before the FloorPlanCAD drawings ran, once. The synthetic set turned out easy: the tuned settings scored a mean F1 of 0.995 against 0.993 for the defaults, so tuning made almost no difference.
Results
Three held-out FloorPlanCAD drawings, picked by file size: a simple structural grid, a medium sheet with doors, a stair and close double lines, and a dense apartment plan.
| Drawing | True lines | Vector paths | Pixels 150 DPI | Pixels 300 DPI | Pixels 600 DPI |
|---|---|---|---|---|---|
| Simple: structural grid | 114 | 1.000 (114) | 0.999 (110) | 1.000 (102) | 1.000 (104) |
| Medium: doors, stair, double lines | 229 | 1.000 (667) | 0.878 (1,217) | 0.890 (1,371) | 0.880 (1,675) |
| Dense: apartment plan | 807 | 1.000 (7,967) | 0.976 (439) | 0.984 (515) | 0.985 (641) |
F1 by length; the number of pieces each method returned is in brackets.
- Speed: on the two simpler drawings the vector route took 5 and 21 ms against 0.25 and 0.39 s for pixels at 300 DPI. On the dense drawing the two were even, 0.38 s against 0.40 s, because the vector route had 7,967 pieces to clean up.
- Resolution: on the dense drawing more pixels helped, cutting the length error from 9.0% at 150 DPI to 0.8% at 600. On the medium drawing it did the opposite (next section).
- A slightly crooked or noisy scan (synthetic, 300 DPI): rotating the page 2° cost 0.3 to 2.4 points of F1; noise plus blur moved it by at most 0.6.
Where Each Method Fails
Vector: right lines, wrong count. The vector route never missed linework here, but it returned the lines in pieces. MuPDF stores an arc as a run of short straight segments, so on the dense drawing 807 true lines came back as 7,967 pieces, about 10 per line. The score is by length, so F1 stays at 1.000. A step that counts walls or measures openings from those pieces would be badly off until they are merged.
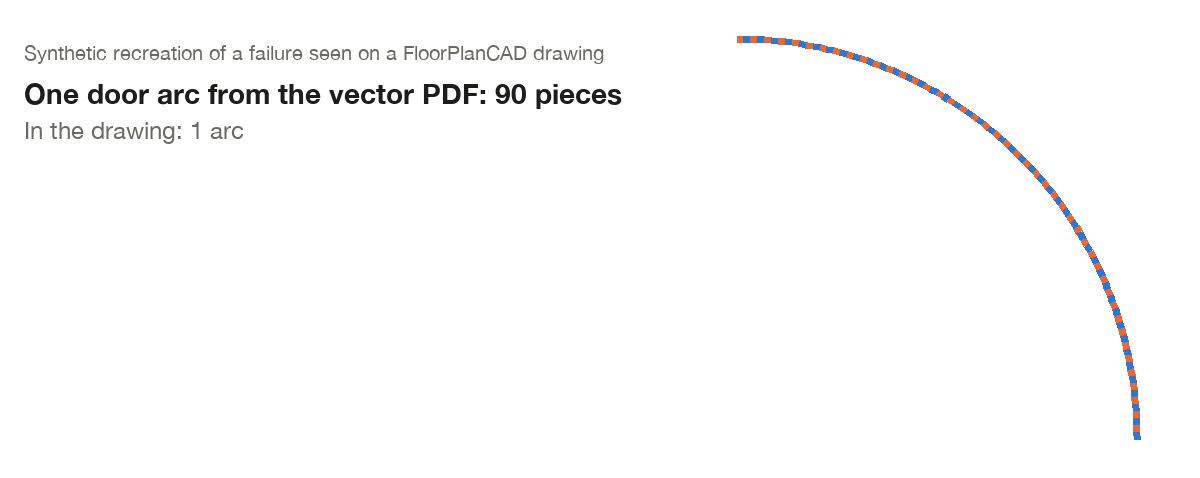
The same thing on a synthetic drawing: one door arc, 90 pieces. On the real drawings it happens to every arc.
Pixels: lines that meet less than 2 pt apart. On the medium drawing, each door panel in a row of double doors is drawn as a thin outline: two edges 1 to 2.4 pt apart (under a millimetre on the page), meeting at shared corners, some drawn twice in different colours. In pixels those strokes merge into one blob. Hough then draws segments through the blob in directions that no real line follows. At 300 DPI, about 80% of the extra length on that drawing sits on double-door linework, with a median distance of only 0.3 pt from a real line: on the ink, but at the wrong angle. More resolution made it worse, not better: precision fell from 0.842 to 0.817 and the length error rose from 2.8% to 25.1% between 150 and 600 DPI. Double door was also the class with the lowest recall (0.890 at 300 DPI). I tried to recreate this on a clean synthetic drawing and couldn't. Neat, evenly spaced panels read fine, so it is the messy real linework that breaks it, and I have no shareable picture of it.
Pixels: small curves. Small circles and the ends of door arcs are where the pixel route misses lines. A circle a few points across comes back as a handful of chords, and the smallest lose whole sides.

Both: text drawn as lines. CAD exports often draw dimension labels as strokes, not as text. Both methods then pick the label up as geometry. On a synthetic page with a "1200" label drawn as lines, every method kept recall at 1.0 and lost precision, the vector route down to 0.963. The FloorPlanCAD SVGs keep text separate, which is why the real drawings didn't show this. Many real PDFs don't.
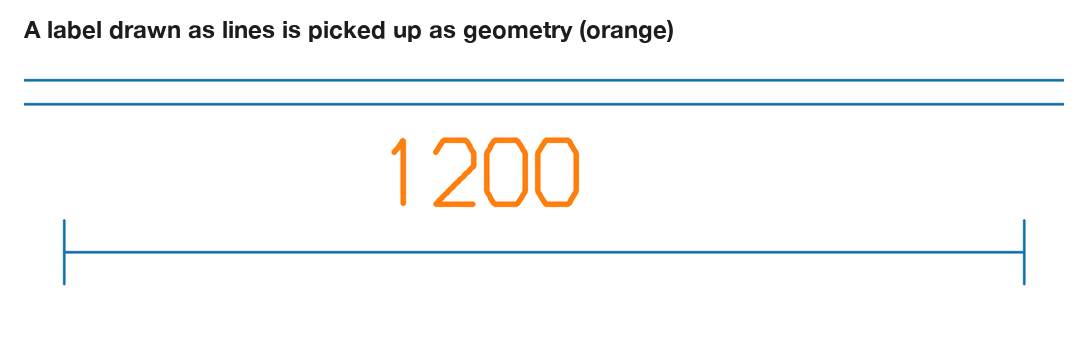
My own bugs, found by looking at the overlays. Two of them changed the numbers, and both now have a test:
- Small circles scored as wrong. The first scorer checked direction on every piece, so a small circle flattened two different ways counted as extra lines. That is where the 4 pt rule comes from.
- Merged walls came out tilted. The first version of the fragment merger grouped pieces by chaining similar angles. The short pieces Hough returns for a circle cover every angle, so the chain linked almost everything, and walls were redrawn along a tilted average direction. Door swings at 600 DPI scored 0.34 before the fix.
What It Means in Practice
- If the PDF still has vector paths, read them. For recovering linework, computer vision only adds error here: the paths are exact and, on the simpler drawings, 19 to 49 times faster to read. Budget for merging the pieces, and for filtering text drawn as lines.
- If the PDF is only pixels, classic computer vision gets you far on clean drawings, with no model to train: F1 0.984 to 1.000 at 300 DPI on the simple and dense drawings. Watch the dense details, such as door panels and tight symbols, where lines meet less than 2 pt apart. There, resolution alone does not help.
- Either way you get lines, not meaning. Neither method knows a wall from a door or a room. That takes a separate recognition step on top, which is a job for a trained model or rules, and is what datasets like FloorPlanCAD were built for.
Limits and What I Would Do Next
| Limit | Why it matters | Next step |
|---|---|---|
| Three real drawings | Shows how the methods behave, not a general accuracy | Run a larger held-out set, stratified by density |
| Vector PDF made from the scoring SVG | Real CAD-exported PDFs add hatching, clipping and layers | Test on PDFs exported directly from CAD tools |
| Straight lines only on the pixel side | Curves come back as chords | Add circle and arc detection (Hough circles or contour fitting) |
| Text drawn as lines is not filtered | Labels pollute the geometry | Detect glyph-sized stroke clusters, or use the PDF's text layer |
| No meaning attached | Lines are not walls or doors | Add a symbol or segmentation step on top of the lines |
Try It
- Run it on your own drawing:
uv run python -m floorplan_parser --input plan.pdf --method vector --output out/plan(install and options). - Switch between the methods and resolutions on the synthetic drawings in the showcase Space.
- Rerun the benchmark: the scorer, the tuning and every result file are in the repo.
If you work with drawing PDFs: how many of yours still have their vector paths, and how many are scans? That answer decides which half of this post matters to you.
References
- Z. Fan, L. Zhu, H. Li, X. Chen, S. Zhu, P. Tan, FloorPlanCAD: A Large-Scale CAD Drawing Dataset for Panoptic Symbol Spotting, ICCV 2021. Annotations CC BY-NC 4.0. Class names follow
config/anno_config.pyin VITA-Group/CADTransformer. - R. O. Duda and P. E. Hart, "Use of the Hough Transformation to Detect Lines and Curves in Pictures", Communications of the ACM, 1972. J. Matas, C. Galambos and J. Kittler, "Robust Detection of Lines Using the Progressive Probabilistic Hough Transform", Computer Vision and Image Understanding, 2000.
- PyMuPDF
Page.get_drawings()and OpenCVHoughLinesP.